Here comes the Santa Claus rally!
Traditionally, the Santa Claus rally has occurred between Dec. 15 and Jan. 6, on average. Since 1950, the S&P 500 Index has gained an average of 2.13 per cent per period and was profitable 80 per cent of the time. The Nasdaq Composite posted a similar frequency of success, gaining an average of 3.17 per cent per period since 1971.
The best return came from the small-cap Russell 2000 Index. The small-cap benchmark gained an average of 3.63 per cent per period since 1987 and was profitable 89 per cent of the time. Best returns for the Russell 2000 Index came following years when the benchmark declined by 5 per cent or more year-to-date by the time the Santa Claus rally period arrived. Then, the benchmark gained an average of 4.94 per cent, thanks to a recovery from year-end tax loss selling pressures. As of Friday's close, the Russell 2000 Index had fallen 6.73 per cent year-to-date.
How has the TSX Composite Index performed during the past 25 periods? Performance was better than the S&P 500 Index. The TSX Composite gained an average of 2.99 per cent per period and was profitable 84 per cent of the time.
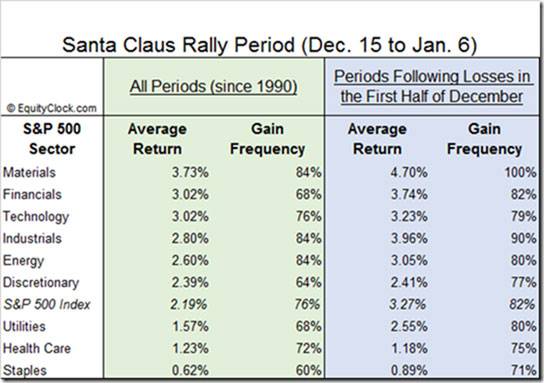
What about performance of sectors in the S&P 500 Index? All sectors profited.
The materials sector recorded the best performance during the past 25 periods with an average gain per period of 3.73 per cent. Other notable returns were record by the energy, industrial, and financial sectors. The weakest sector was consumer staples, which averaged a gain of only 0.62 per cent per period.
The best way to take advantage of this seasonally strong period that runs through the end of the year is to buy the losers from the first half of December. Best performing sector following declines in the first half of December was the materials sector with an average gain of 4.70 per cent per period and a frequency of profitability of 100 per cent. As of the close on Friday, only consumer staples had recorded a month-to-date gain while utilities, energy, industrials, materials, consumer discretionary and financials recorded more than a 2 per cent decline.
Why does the Santa Claus rally work? The event is more than a guy in a red suit coming to town. General influencing factors include upbeat investor sentiment, lighter trading volumes, encouraging economic news, bullish reports by investment dealers highlighting prospects for the following year, expectations for stronger than consensus fourth quarter earnings triggered by news of strong consumer holiday spending and the investment of year-end bonuses. All are expected to help equity market performance during the upcoming period. In addition, selected equities, which have over-reacted to tax loss selling pressures, frequently rebound from bargain prices.
What about this year? Several unique events have come together that favour a strong Santa Claus rally this year. North American equity markets have been under pressure since last May, partially due to concerns that interest rates in the United States will begin to increase for the first time in a decade. Related to anticipation of an increase in interest rates has been strength by the U.S. Dollar Index. The likely increase in the Fed Funds rate on Wednesday is expected to be followed by at least a brief period of interest rate stability in the United States and a related period of stability in the U.S. Dollar Index. Both will relieve investor concerns, at least into early 2016. Other unique events this year include benefits from lower gasoline prices and the El Nino effect
Tax-loss selling pressures are another important issue this year, particularly among Canadian commodity sensitive stocks. When tax loss selling pressures are relieved, a strong recovery is possible, particularly among forest product, precious metal and base metal stocks. Last trade date for Canadian investors to liquidate listed Canadian equity positions in 2015 is Dec. 24. Better to not wait until the last minute if planning to sell equities for tax reasons. Liquidity in equity markets becomes thin before Christmas.
Traders and investors can take advantage by owning a wide variety of U.S. and Canadian equities and Exchange Traded Funds during the current December 15th to January 6th period. ETF examples focusing on U.S. equity indices include S&P 500 SPDRs (SPY-N) and Russell 2000 iShares (IWM-N). Choices for Canadian equity index funds include iShares S&P/TSX 60 units (XIU-T), Horizons S&P/TSX 60 units (HXT-T), BMO S&P/TSX Capped Composite units (ZCN-T) and First Trust AlphaDEX Canadian Dividend Plus ETF (FDY-T). Choices for top ETF sector funds include Materials Select Sector SPDRs (XLB-N), Financials Select Sector SPDRs (XLF-N), Technology Select Sector SPDRs (XLK-N) and Industrials Select Sector SPDRs (XLI-N).
Don and Jon Vialoux are authors of free daily reports on equity markets, sectors, commodities, and Exchange Traded Funds. Daily reports are available at http://TimingTheMarket.ca/ and http://EquityClock.com. The enclosed report is for information only. It should not be considered as advice to purchase or to sell mentioned securities. Data offered in this report is believed to be accurate, but is not guaranteed.