I came across a very insightful article on Globe Unlimited last week. Written by in-house analyst Scott Barlow, it raised concerns about the current yield curve and its implications for the future of the stock market.
What's a yield curve, you may ask? Simply put, it's a graphic representation of the difference between short-term interest rates and long-term ones. When long-term rates are much higher, the yield curve is described as "steep." When they are lower (which is rare), the curve is said to be "inverted." When yields at both ends are more or less the same, the curve is called "flat."
All this is important because studies have shown over the years that the bond yield curve is one of the best predictors of the direction of the economy and the stock market over the next 12-18 months.
This is not some off-the-wall Super Bowl kind of prognostication. The website of the Federal Reserve Bank of New York devotes significant space to the importance of the yield curve and notes in a Q&A that: "The difference between long-term and short-term interest rates ('the slope of the yield curve' or 'the term spread') has borne a consistent negative relationship with subsequent real economic activity in the United States, with a lead time of about four to six quarters."
Right now, Canada is look at an almost flat yield curve on bonds out to three years. Here is the situation as of Feb. 24 according to the Bank of Canada website. The yields are for Government of Canada benchmark bonds and Treasury bills.
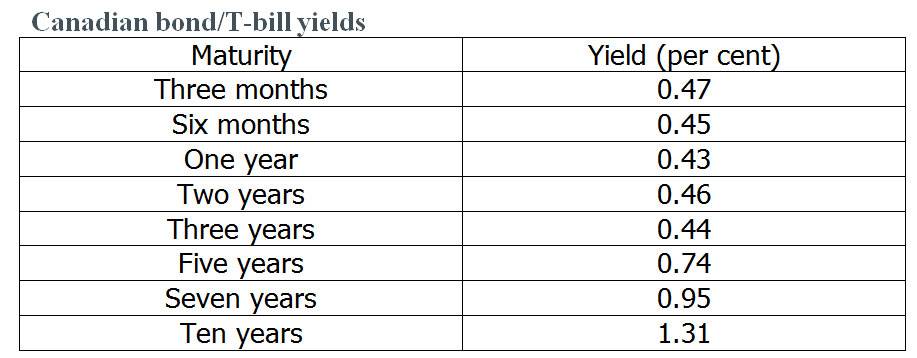
What these numbers suggest is that bond traders do not anticipate any significant improvement in the Canadian economy for the next three years. After that, they're expecting a gradual pick-up but nothing outstanding. The only encouraging news is that benchmark bond yields showed modest gains toward the end of the week.
This does not bode well for the TSX in the short term. The energy sector has already suffered significant losses and unless the price of oil performs a remarkable, and unlikely, turnaround in the next few months we should not expect much improvement. Now the other pillar of our stock market, financials, is also coming under pressure as persistent low interest rates squeeze profit margins. As of Thursday's close the financials sector was down 1.8 per cent so far this year, despite generally decent quarterly reports from the banks. Energy and financial stocks make up more than 55 per cent of the S&P/TSX Composite so you can see the kind of headwinds we're up against.
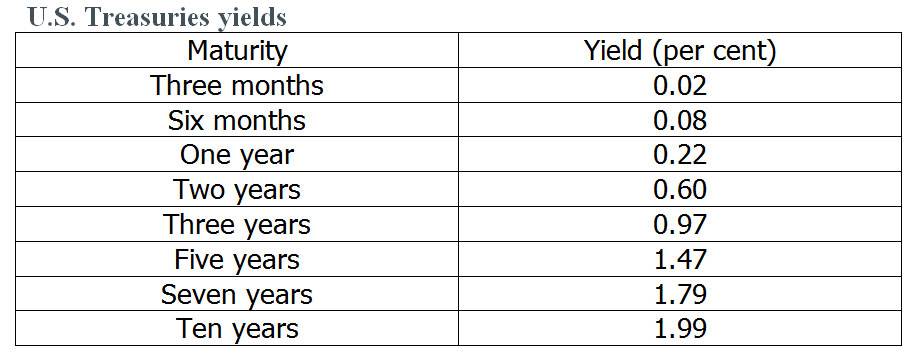
In the U.S., the yield curve looks a little healthier. Here are the numbers for U.S. Treasuries as of Feb. 24.
How accurate is the yield curve indicator?
In recent years, it's been extremely accurate. I found an article on Investopedia that graphically depicted the U.S. yield curve as of January 2008. It showed a sharp decline (an inverted yield curve) going out two years, after which it rebounded strongly. In September of that year, Lehman Brothers collapsed, triggering a stock market meltdown and the Great Recession.
So what should you do with this information? For starters, be cautious about your Canadian stock holdings. Focus on lower-risk defensive stocks (utilities, consumer staples, telecoms) and increase weightings in cash and short-term bonds.
The U.S. economic situation looks healthier by yield curve standards so if you have not already done so, add to your American securities, either by buying stocks directly or investing in mutual funds or ETFs that focus on the States.