Hey Lou,
I have been looking into a midstream company for the last little while and I am wondering what your thoughts are on Inter Pipeline and Pembina. Is it the right time to enter a position on either of them? If so which would you recommend?
Any input would be much appreciated!
Thank you in advance,
Lorenzo
Hey Lorenzo,
Thanks for the assignment. I will analyze Inter Pipeline Ltd. (IPL) today and Pembina Pipeline Corp. (PPL) in my next post. This will be the fifth time since 2011 that I inspect the case for IPL. The last examination was completed on June 17, 2013 when the shares were trading at $23.77 and the dividend produced a 4.79-per-cent yield. Irene wanted my opinion and the research conducted on her behalf identified a number of patterns that supported the summary recommendation to hold the stock.
The shares had hit a 52-week high of $24.47 in April of 2013 and were pulling back. The stock had broken below the 50-day moving average and was testing support along the 200-day moving average. The review identified that IPL had been enjoying an established uptrend that started in March of 2009. Over the course of the advance, it had tested support along the 200-day moving average a number of times without a serious breach.
It was advised to hold the stock with the caveat that she should maintain surveillance to ensure that support at $23.00 held and to watch for a break above resistance at $24.00. Retrospectively, it was the right call. By December of 2013, IPL broke above $24.00 with conviction and started a new leg up that took the shares to a 52-week high of $38.95 by September of 2014. The shares have since been in retreat and the question is if now is a good time to buy.
A scout of the charts will identify the patterns that will highlight the trend, support, and resistance as they pertain to IPL.
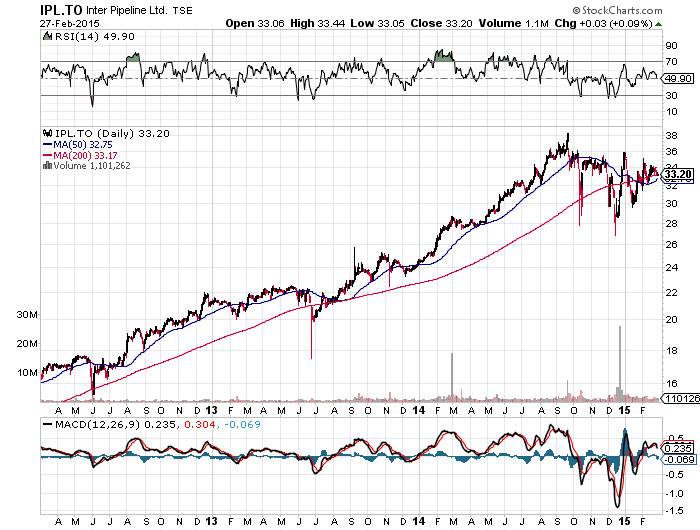
The three-year chart indicates that the stock found support in the $28.00 range as it came off the September 2014 highs. In 2015, the shares have held support at $32.00 and the 200-day moving average. The MACD and the RSI both generated buy signals in mid-December 2014 as the stock bounced off $28.00 and ran to $36.00 by the end of the month. A nice move of $8.00 in two weeks
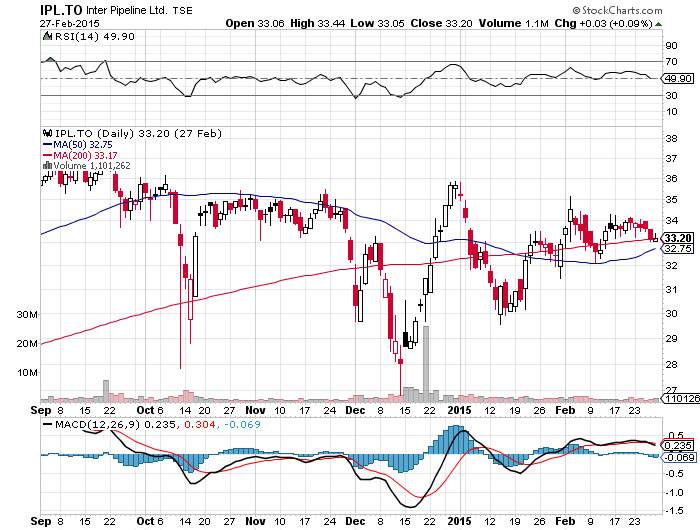
The six-month chart provides a close-up of the support along the 200-day moving average that could set the stage for a new leg up. The MACD and the RSI are neutral at this time which suggests that the stock may need to build a bigger base before we can expect a move up. With a 4.43-per-cent dividend yield, you would be earning a reasonable rate while waiting for Mr. Market to smile on IPL.
Make it a profitable day and happy capitalism!
Have your own question for Lou? Send it in to lou@happycapitalism.com.