Hi Lou,
Really enjoy your commentary.
Can you please let me know your thoughts on Africa Oil? It's seen a massive drop in share price – is this something you would consider?
Thanks,
Sean
Hey Sean,
Thanks for the assignment and your kind words.
This will be the third time that I investigate the details associated with Africa Oil Corp. (AOI). The last was on Nov. 23, 2012, when the shares were trading for $10.46. Robbie wanted to know more about the story and the research conducted indicated that there was resistance at $10.75. It was noted that the stock needed to move through $11.00 to signal that there was more to the advance that had started in December of 2011.
It was also cited that there was an ascending triangle that had formed. An ascending triangle is a continuation pattern which indicates that there could be more gains to come. It was cautioned that a pattern is not a guarantee and that having money at risk demanded constant scrutiny. In hindsight that was the right call. AOI never could stimulate enough buying to break above $11.00 and the ascending triangle proved a false signal.
In December of 2013 the stock once again hit resistance at $11.00 and began a decline taking the shares down to a a 52-week low of $1.98 by December of 2014. Clearly a lot of the selling has come on the weakness in oil prices that started in the summer of 2014.
Another inspection of the charts will help identify the potential for AOI.
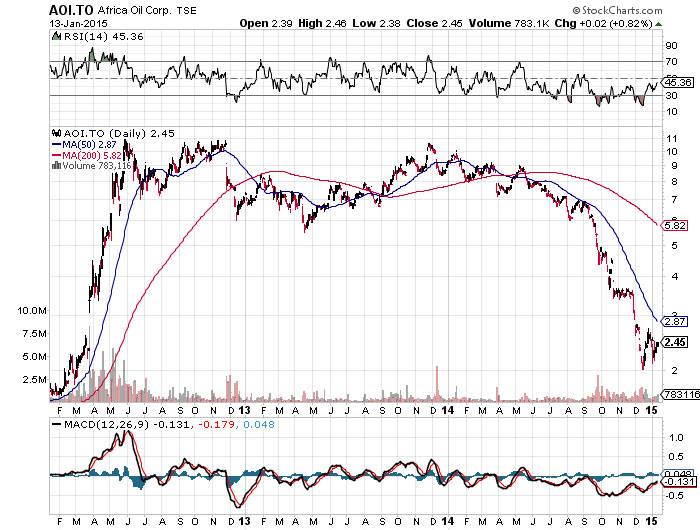
The three-year chart depicts the downtrend that has been in place since 2013 and the death cross that formed in April of 2014. What is evident is that AOI was trading in a down channel until October of 2014 when it breached support along the lower rail and went into a free fall along with most of the energy sector.
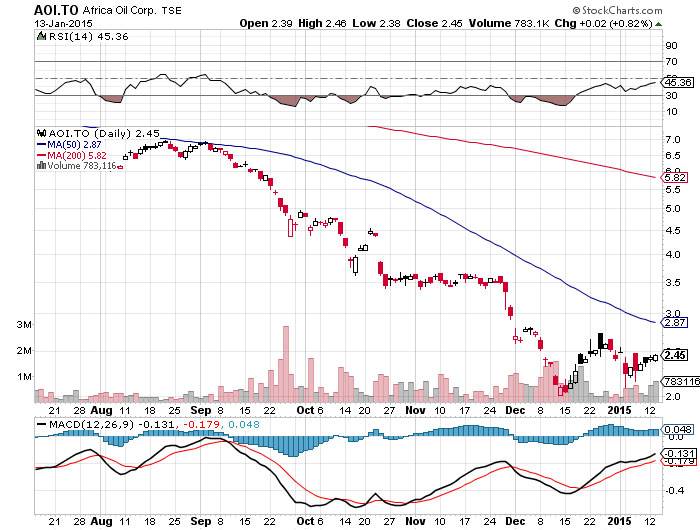
The six-month chart highlights that there was plenty of time to get off this ride and preserve capital. Make note of the sell signals generated by the MACD and the RSI in September and November as investors hit the sell buttons. In December the momentum indicators signalled a buy as AOI was oversold. The stock caught a bounce off the 52-week low to $2.58 by December 29.
Until energy prices stabilize the best approach when considering investments in the sector is to trade for profits. Currently there are no indications that we can expect a trend reversal so pick your spots carefully. What you should also recognize with this company is that it has yet to generate any sales and is operating in an extremely volatile area of the global economy.
Make it a profitable day and happy capitalism!
Have your own question for Lou? Send it in to lou@happycapitalism.com.