Hi Lou,
Could we get your analysis of Inter Pipeline as you so kindly did for us a few years ago.
Please and thanks.
Douglas and Irene from Kelowna
---
Hey Douglas and Irene,
Always great to hear from you and thanks for the assignment. This will be the sixth time that I analyze the charts for Inter Pipeline Ltd. (IPL-T) since 2011. The previous occasion on your behalf was on June 17, 2013 when the shares were trading for $23.33. The analysis conducted led a recommendation that you hold the stock which turned out to be the right call.
The last time I examined the stock was in March for Lorenzo. The shares were trading for $33.20 and had been trying to build a base after a pullback. There was support along the 200-day moving average and the moving average convergence divergence (MACD) and the relative strength index (RSI) were neutral at the time. With a dividend yield of 4.43 per cent, it was noted that investors were being paid a reasonable amount to wait for a turn.
Unfortunately, the support didn't hold and, in short order, the shares retreated to near $29.50 by mid March. The quick retreat was followed by a sharp bounce to near $31.70.
Another inspection of the charts will help identify how best to manage this asset.
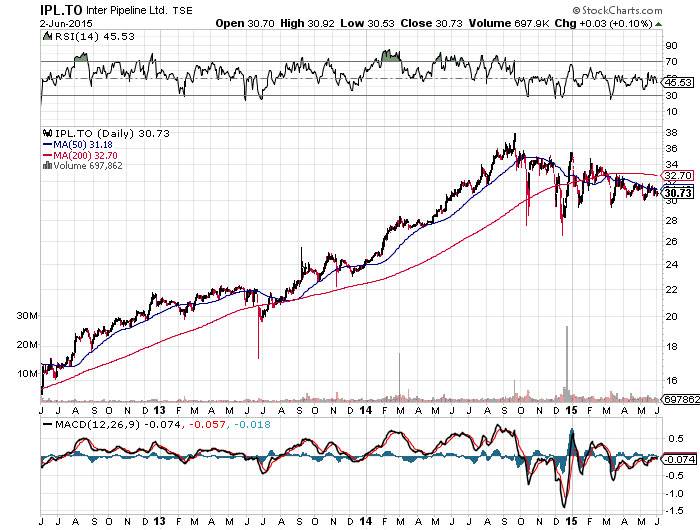
The three-year chart indicates that a downtrend has been in play since the shares came off the 52-week high of $38.95 in September of 2014. The support along the 200-day moving average in March failed, and now the stock is meeting resistance along the 50-day moving average. There is some support building along $30.50, but there also appears to be a descending triangle in place.
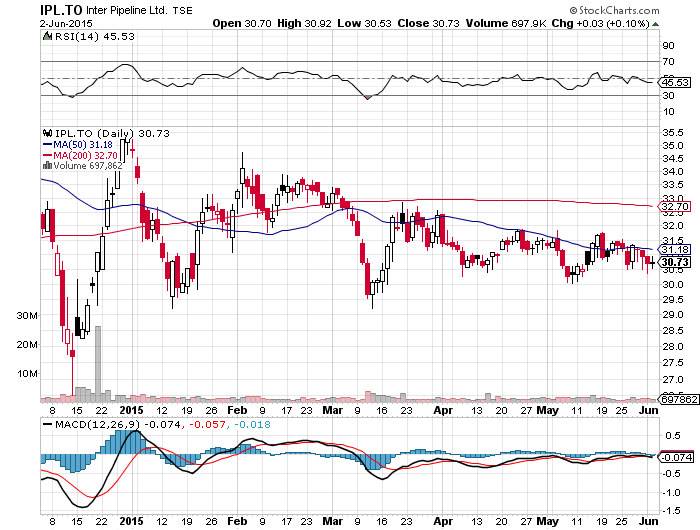
The six-month chart highlights the resistance along the 50-day moving average that has met every attempt to move higher. The support along $30.50 is forming the base of the descending triangle that shouldn't be ignored. At this point in time, there are no indicators that are pointing to a reversal of the downtrend that started eight months ago. If you are considering buying IPL, it would be best to wait until the descending triangle is resolved.
If you own IPL, the next level of support comes in at $29.50 and then at $28.00.
Next time, I will investigate the potential for Suncor Energy Inc. for Vito
Make it a profitable day and happy capitalism!
Have your own question for Lou? Send it in to lou@happycapitalism.com.