Dean Wilkinson, an analyst at CIBC World Markets, developed a model that refines the relationship between REIT prices and bond yields to uncover a better indicator of sector returns. Currently, the model implies that real estate investment trusts are dramatically oversold.
Mr. Wilkinson found that while nominal value of the 10-year bond yield is relevant to REIT returns, it is actually the shape of the government bond yield curve that matters most.
Real estate investors that follow the steepness of the Canadian yield curve – the difference between the 10-year bond yield and the two-year yield – will have a better indicator of future returns than investors that merely follow bond yields on their own.
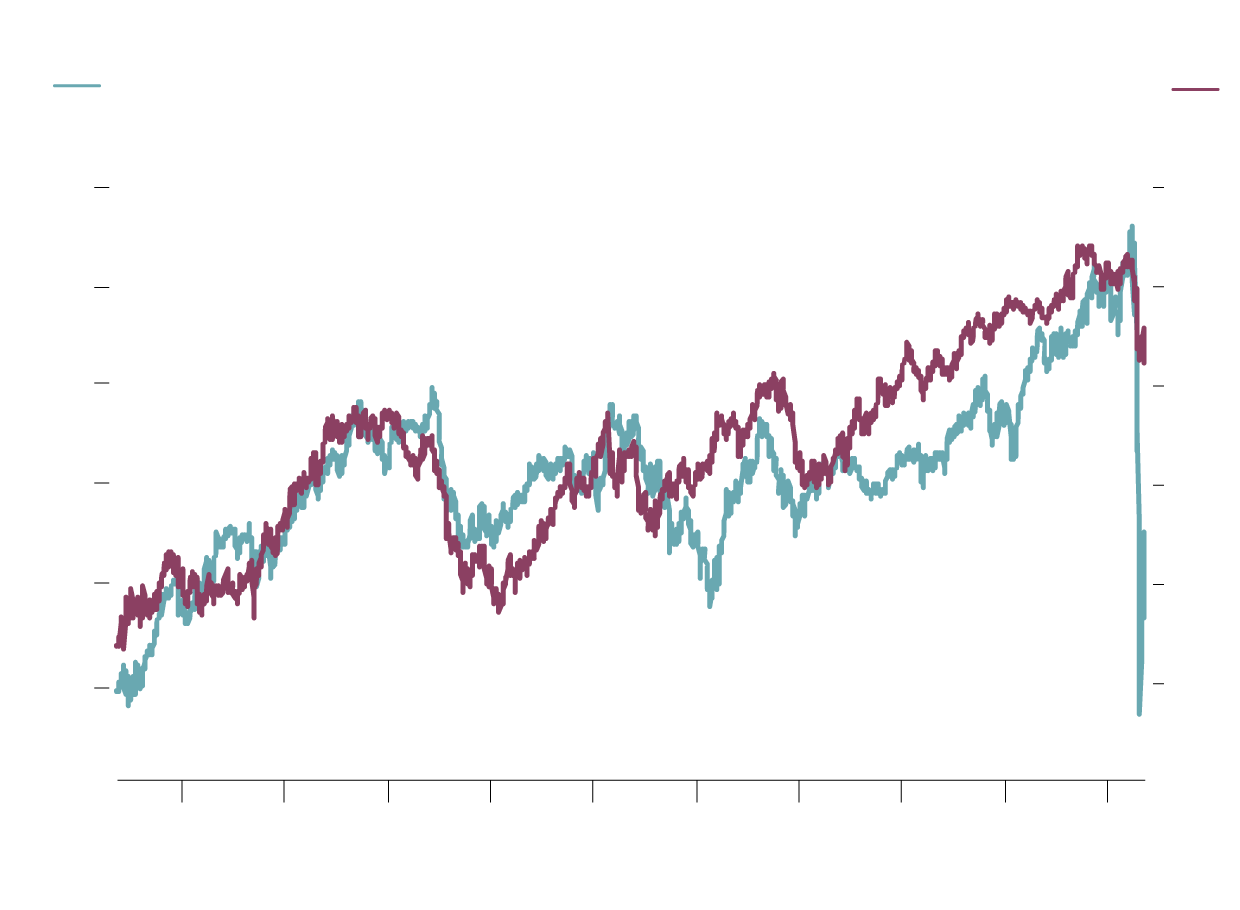
The accompanying chart shows how this works. The blue line plots the market value of the the iShares S&P/TSX Capped REIT Index ETF (XRE) and the purple line shows the difference between 10-year and two-year government of Canada bond yields.

REIT returns signalled by yield curve
iShares S&P/TSX
Capped REIT Index ETF
Yield steepness: Gov’t of Canada
10Y yield minus 2Y yield (bps, inverted)
$22
-50
20
0
18
50
16
100
14
150
12
200
10
250
2010
2012
2014
2016
2018
‘20
JOHN SOPINSKI/THE GLOBE AND MAIL
SOURCE: scott barlow; bloomberg

REIT returns signalled by yield curve
iShares S&P/TSX
Capped REIT Index ETF
Yield steepness: Gov’t of Canada
10Y yield minus 2Y yield (bps, inverted)
$22
-50
20
0
18
50
16
100
14
150
12
200
10
250
2010
2012
2014
2016
2018
‘20
JOHN SOPINSKI/THE GLOBE AND MAIL
SOURCE: scott barlow; bloomberg
REIT returns signalled by yield curve
iShares S&P/TSX
Capped REIT Index ETF
Yield steepness: Gov’t of Canada
10Y yield minus 2Y yield (bps, inverted)
$22
-50
20
0
18
50
16
100
14
150
12
200
10
250
2010
2011
2012
2013
2014
2015
2016
2017
2018
2019
‘20
JOHN SOPINSKI/THE GLOBE AND MAIL, SOURCE: scott barlow; bloomberg
Note that the yield curve is plotted inversely to better show the trend – a rising purple line, for example, means the curve is flattening.
The two lines on the chart have moved closely together for the majority of the past decade and the tight relationship is supported by correlation calculations. In short, the performance patterns on the chart show that REITs perform best when the yield curve flattens.
A market concept called “term premium” explains the trends on the chart.
In a normal upward sloping yield curve, longer duration bonds yield more than shorter-term bonds. The higher yields compensate investors for the added risk of locking in to set bond yields for the longer term. The extra yield on longer-term bonds is called the term premium.
When the yield curve flattens, as it did steadily between March of 2017 and September of 2019, the term premium – the added yield on longer-term bonds – steadily evaporates. With a flat yield curve, income-oriented investors are no longer motivated to buy bonds with longer duration.
Mr. Wilkinson believes the REIT sector is among the primary beneficiaries of flattening yield curves. “Conceptually, I think that what you get in a flattening of the curve is simply a stretch for yield – when there is no term premium on the longer end of the curve I think investors simply look to alternatives[ like REITs]," he told me in an e-mail.
Currently, the chart implies that the REIT sector is significantly undervalued relative to the yield curve. The sharp drop in the REIT index reflects legitimate fears about cash flows during the quarantine as many people and businesses might not be able to pay rent.
The connection between the yield curve and REIT prices carries significant implications for investors for the remainder of this very difficult 2020. The 10-year bond yield has fallen about 100 basis points year-to-date, keeping the curve flat despite the Bank of Canada interest-rate cuts that pushed shorter-term bonds lower. (There are 100 basis points in a percentage point.)
As the crisis ends, the 10-year yield is likely to climb on expectations for a resumption in economic growth. This would steepen the yield curve and limit returns from the REIT sector as unit prices recover from virus-related uncertainty. The longer that economic growth seems threatened and the 10-year yield remains depressed, however, the better REITs should perform.