
Traders work on the floor of the New York Stock Exchange at the opening bell on Nov. 13.ANGELA WEISS/AFP/Getty Images
Investors who aren’t quite sure what to make of this year’s dazzling run-up in stock prices might want to take a break from counting their gains and start estimating the bezzle.
That is the playful term that the great Canadian-American economist John Kenneth Galbraith used to describe the amount of illusory wealth in an economy. He derived the word from embezzlement because the bezzle often arises from deliberate fraud. During the time between when an embezzlement is committed and when the fraud is discovered, victims mistakenly feel they are rich. They’re blinded by the bezzle.
The bezzle, though, can involve more than just outright fraud. Charlie Munger, the billionaire investor and vice-chairman of Berkshire Hathaway who passed away last year, stretched the term and included within it all the psychological distortions – from stock market bubbles to investing fads – that encourage asset prices to climb far above their intrinsic value.
Whether asset prices are inflated by deliberate fraud or by simple high spirits, the bezzle never ends well. At some point, reality asserts itself. Wealth vanishes; the bezzle shrivels. People who thought they were rich suddenly discover they’re not.
This unpleasant sequence is worth keeping in mind because right now the bezzle appears to be running unusually high. Granted, there is no foolproof way of gauging its size. Still, there are lots of clues.
Consider the 40-per-cent surge in the price of bitcoin over the past month. It’s a case of an asset with no dividends and no earnings soaring in value simply because people figure other people are going to get excited about it now that crypto-booster Donald Trump is headed back to the White House. That seems like rather a flimsy reason for such a big move in price.
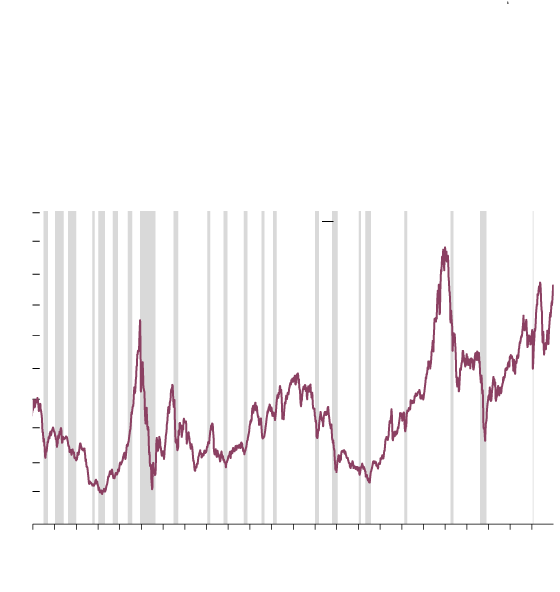
Up, up and awry
One way to see if stocks are expensive is to remove the effects of the business cycle and compare current share prices to their average real earnings per share over the past decade. This cyclically adjusted price-to-earnings ratio, or CAPE, shows U.S. stocks are at some of their most expensive levels since the dotcom bubble of the 1990s, with CAPE hovering around 38, far above its long-run average of 17. (Cyclically adjusted price-to-earnings ratio)
50
Recessions
45
40
35
30
25
20
15
10
5
0
1910
‘20
‘30
‘40
‘50
‘60
‘70
‘80
‘90
‘00
‘10
‘20
the globe and mail, Source: Robert Shiller, Apollo Global Mgmt.
How quickly can such valuations reverse? Look at the bankruptcy of Swedish battery-maker Northvolt AB a couple of weeks ago. The abrupt failure of the company – a star of the European green-energy scene – caught its backers by surprise. Goldman Sachs, one of the company’s largest investors, was forced to mark down its stake in Northvolt from US$900-million to zero.
It’s rather shocking that nearly a billion dollars can vanish like that, but such things happen when valuations are based, like Northvolt’s, on hazy guesses about how great things are going to be a few years from now.
The U.S. stock market is packed with such optimistic assumptions. Excitement over the potential of artificial intelligence (AI) has driven valuations in the tech sector to staggering heights. Meanwhile, steady but unexciting performers such as Walmart Inc. WMT-N and Home Depot Inc. HD-N are trading at the type of lofty price-to-earnings multiples that used to be reserved for high-growth startups.
Wall Street analysts don’t deny the frothiness. The Levkovitch Index of economic indicators compiled by Citigroup analysts suggests the market has been in a “euphoria” stage for months. Meanwhile, the widely followed CAPE indicator – a measure of how stock prices compare to long-term earnings – is now around its giddiest levels since the dot-com bubble of the late 1990s.
Oddly, though, no one seems that concerned. Strategists at BlackRock or Capital Economics are advising clients to stay the course with U.S. stocks for now. It’s not because they see things getting saner. It’s because they expect things to get even crazier.
That is entirely possible for at least three reasons. First, the new administration in Washington is likely to persist in running up enormous fiscal deficits, meaning the U.S. economy could continue to hum. Second, AI euphoria shows no signs of weakening.
Finally, international investors suffer from a lack of alternatives. China is sputtering, Europe is in disarray, Japan has its unique challenges for foreigners, Canada and Mexico face the threat of Mr. Trump’s tariffs. For many global stock buyers, the U.S. market is the only game worth playing.
So what should investors do? If you’re feeling brave, you could try to time the insanity. Capital Economics expects the S&P 500 index to climb from its current level around 6,000 and reach 7,000 in 2025, before the AI bubble pops and it all comes crashing down.
Just remember that setbacks can be sudden. A recent analysis by RBC Global Asset Management concluded that about 30 per cent of the incredible run-up in U.S. stock prices since 2007 has been the result of higher price-to-earnings ratios – in other words, the willingness of people to pay ever greater amounts for a dollar of earnings. This cannot go on forever and could reverse direction with surprising speed.
Rather than trying to time the market, investors might want to take refuge in a classic 60-40 portfolio composed of 60 per cent globally diversified stocks and 40 per cent bonds. Both Vanguard Canada and RBC iShares offer versions of this portfolio in a low-cost exchange-traded fund (ETF) format. Their offerings (VBAL-T and XBAL-T, respectively) give you exposure to the U.S. stock market, but balance it with more reasonably priced international stocks as well as bonds.
A 60-40 portfolio is not an exciting investment and that is precisely the point. When the bezzle is as high as it now appears to be, reducing risk is more important than seeking maximum returns.