
The recent weakness in global oil prices is likely a result of speculative froth burning off and funds reducing optimistic bets on the commodity price. The latest data on futures market positioning suggest the process has a bit further to go.
This trend is not cause for major concern for bullish investors in the short term. But the lack of commodity-price response to recent supply disruptions and expectations for an extended build in crude inventories should provide reason for caution in the mid-term. Hedge-fund managers have just started to increase their bearish oil positions for the first time since the start of the year. So far, their timing is working out, with West Texas Intermediate retesting the US$60-a-barrel level over the past few days, including a drop of 85 US cents to US$61.40 on Tuesday.
EXCESSIVE BULLISHNESS
WTI crude US$/bbl
Non-commercial futures net position
(right scale, contracts in thousands)
$120
800
700
100
600
80
500
60
400
300
40
200
20
100
0
0
2015
2016
2017
2018
‘19
2014
CARRIE COCKBURN / THE GLOBE AND MAIL,
SOURCES: SCOTT BARLOW, BLOOMBERG
EXCESSIVE BULLISHNESS
WTI crude US$/bbl
Non-commercial futures net position
(right scale, contracts in thousands)
$120
800
700
100
600
80
500
60
400
300
40
200
20
100
0
0
2014
2015
2016
2017
2018
‘19
CARRIE COCKBURN / THE GLOBE AND MAIL,
SOURCES: SCOTT BARLOW, BLOOMBERG
EXCESSIVE BULLISHNESS
WTI crude US$/bbl
Non-commercial futures net position (right scale, contracts in thousands)
$120
800
700
100
600
80
500
60
400
300
40
200
20
100
0
0
2015
2016
2017
2018
‘19
2014
CARRIE COCKBURN / THE GLOBE AND MAIL, SOURCES: SCOTT BARLOW, BLOOMBERG
This latest slide in prices is occurring despite troubles on the global supply side that have highlighted the importance of rising U.S. shale oil production in reducing global oil supply fears.
In Russia, the second-largest supplier of oil to Europe, a contamination issue has drastically reduced the flow of crude between Russia and the region. Global oil supply had already been disrupted by political sanctions on Iraq and Venezuela. A decade ago, this combination of supply constraints would likely have sent oil traders into a prolonged period of panicked buying.
GLOBAL LIQUID FUEL INVENTORIES:
QUARTERLY CHANGE
World liquid fuels: inventory change
World liquid fuels: projected inventory change
(both in millions of barrels per day)
2
1.5
1
0.5
0
-0.5
-1
-1.5
1
2
3
4
1
2
3
4
1
2
3
4
1
2
3
4
1
2
3
4
1
2
3
4
1
2
3
4
2014
2015
2016
2017
2018
2019
2020
Quarters
CARRIE COCKBURN / THE GLOBE AND MAIL,
SOURCES: SCOTT BARLOW, ENERGY INFORMATION AGENCY
GLOBAL LIQUID FUEL INVENTORIES:
QUARTERLY CHANGE
World liquid fuels: inventory change
World liquid fuels: projected inventory change
(both in millions of barrels per day)
2
1.5
1
0.5
0
-0.5
-1
-1.5
1
2
3
4
1
2
3
4
1
2
3
4
1
2
3
4
1
2
3
4
1
2
3
4
1
2
3
4
2014
2015
2016
2017
2018
2019
2020
Quarters
CARRIE COCKBURN / THE GLOBE AND MAIL,
SOURCES: SCOTT BARLOW, ENERGY INFORMATION AGENCY
GLOBAL LIQUID FUEL INVENTORIES: QUARTERLY CHANGE
World liquid fuels: inventory change
World liquid fuels: projected inventory change
(both in millions of barrels per day)
2
1.5
1
0.5
0
-0.5
-1
-1.5
1
2
3
4
1
2
3
4
1
2
3
4
1
2
3
4
1
2
3
4
1
2
3
4
1
2
3
4
2014
2015
2016
2017
2018
2019
2020
Quarters
CARRIE COCKBURN / THE GLOBE AND MAIL, SOURCES: SCOTT BARLOW, ENERGY INFORMATION AGENCY
Growth in U.S. oil production is the main reason oil markets are less concerned about oil shortages. Thanks to shale reserves, the United States now produces 12.3 million barrels of oil daily – 6.8 million barrels a day more than at the beginning of 2010. Production growth shows no signs of slowing, and new pipeline capacity is set to increase the shale oil available to U.S. and global markets.
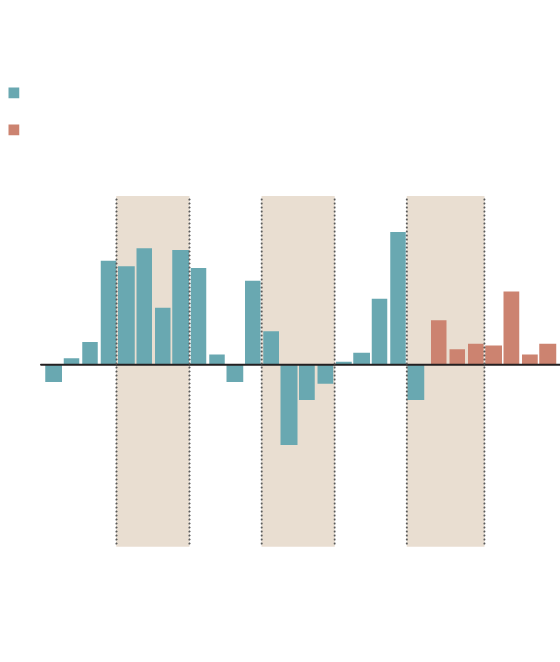
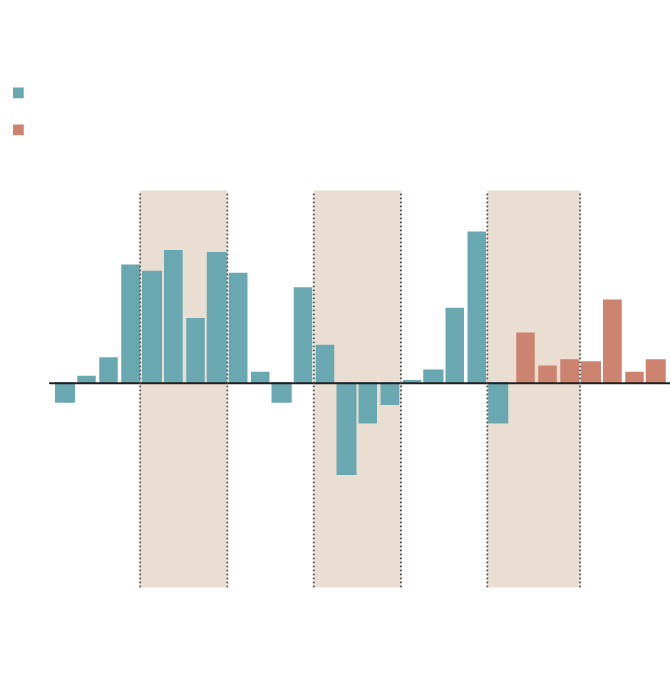
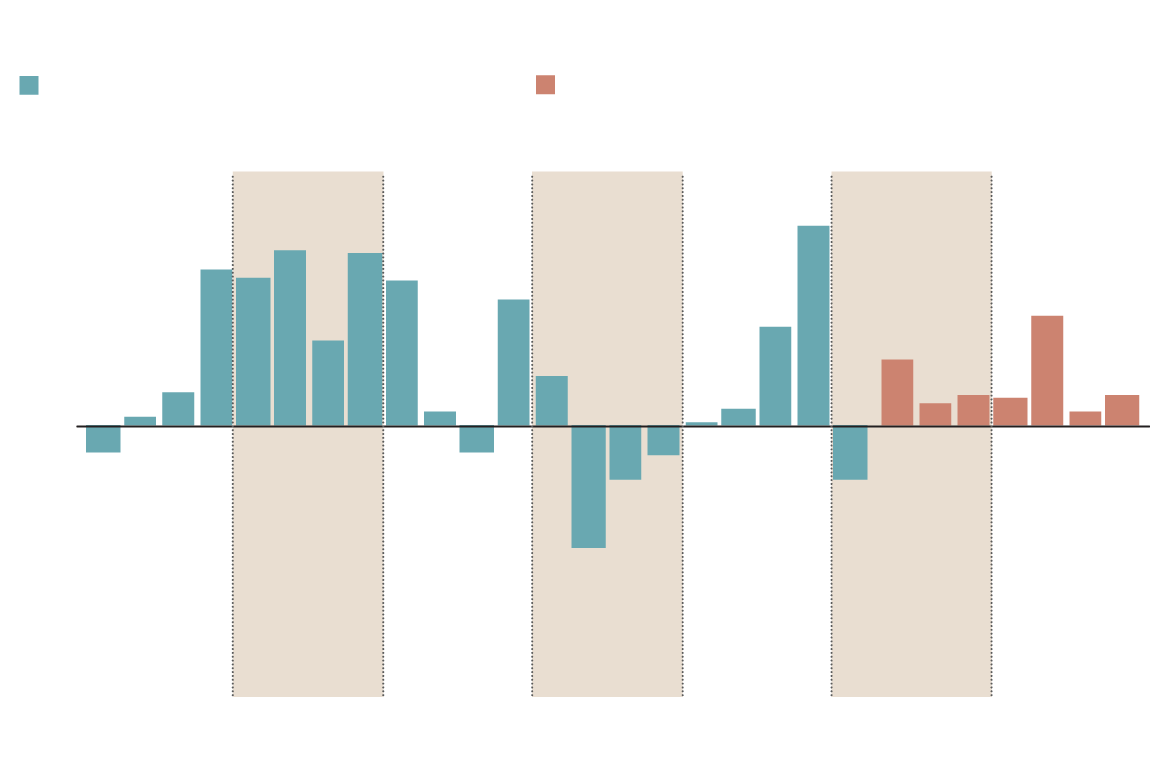
The Washington-based Energy Information Agency (EIA) expects a steady climb in global liquid fuel inventories in the coming months. The first accompanying chart shows the past quarterly change in global fuel inventories and estimates for the future.
The first quarter of 2019 saw a draw in inventory levels – a bullish sign for the crude price. The EIA forecasts, however, that excess supply will result in inventory builds beginning in the current quarter and extending until the end of 2020.
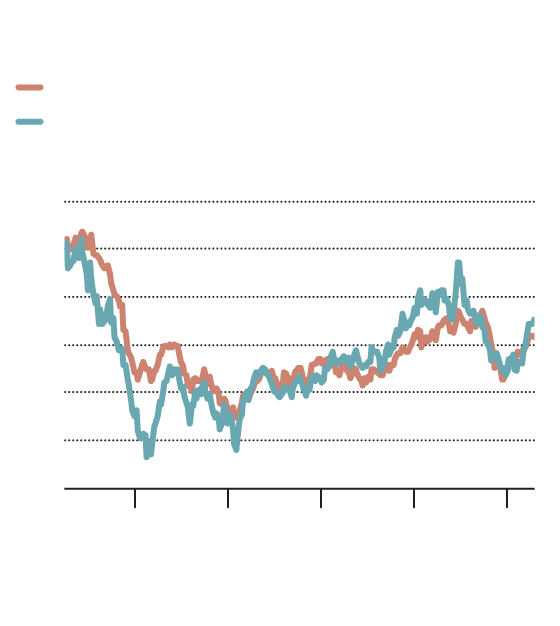
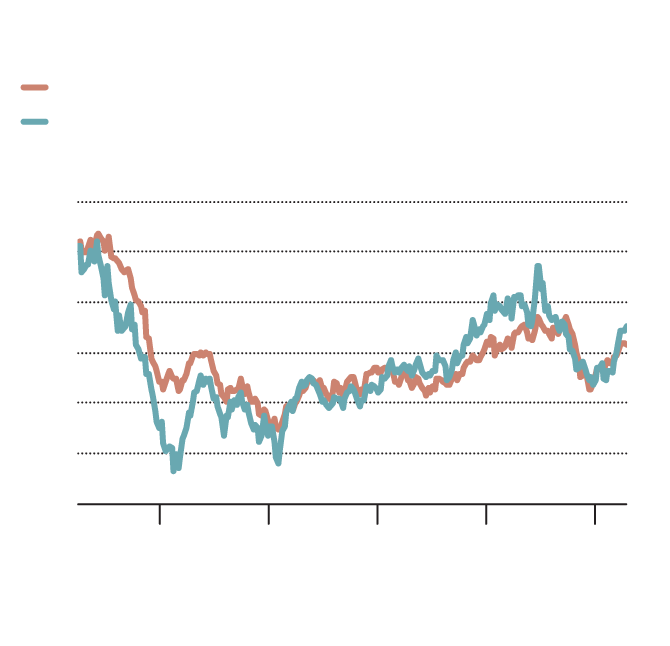
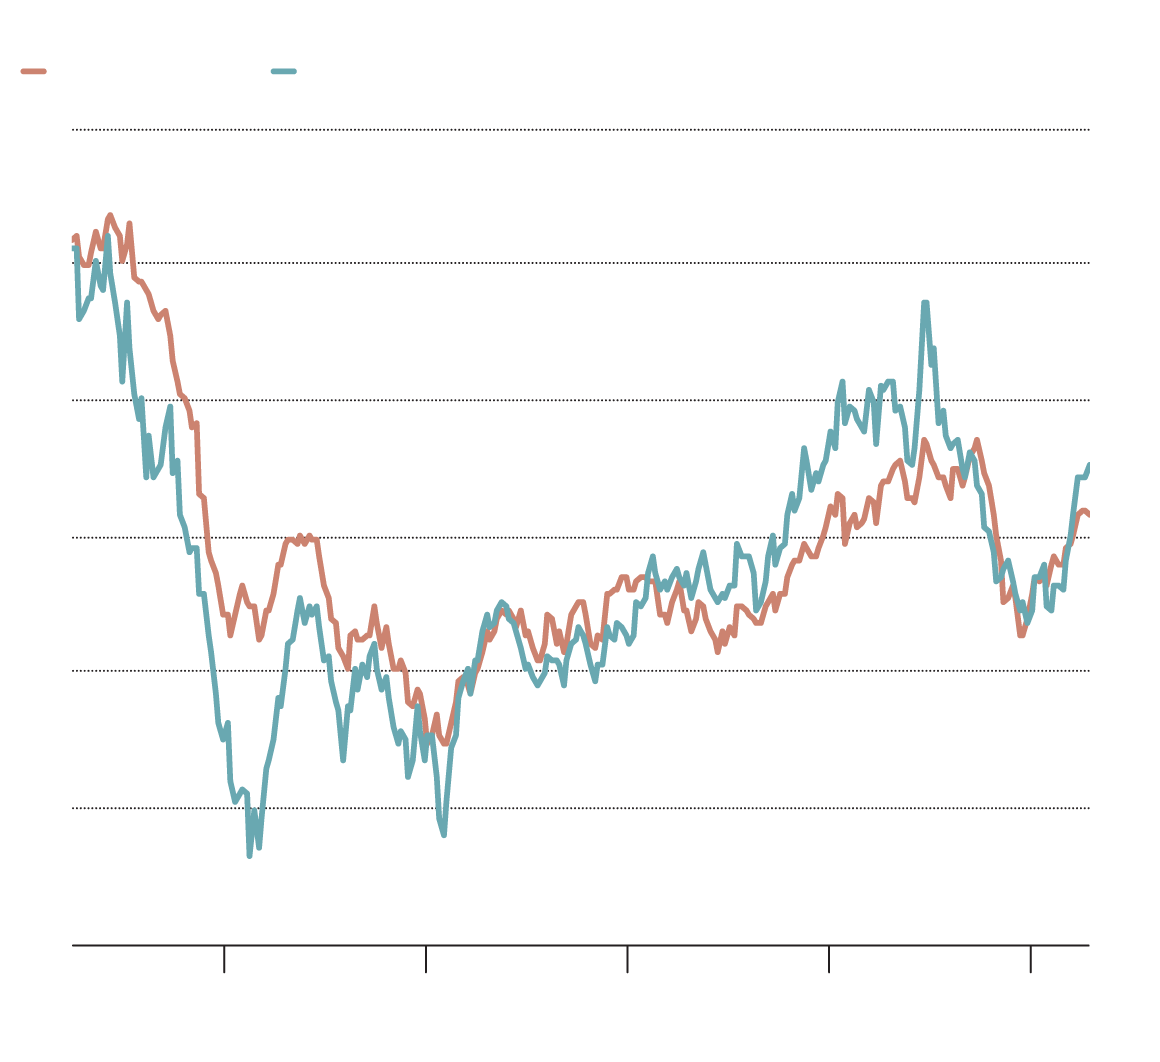
The West Texas Intermediate crude futures curve – specifically the difference between the one- and 12-month futures prices – has historically provided an indicator for changes in inventory levels and, by extension, the commodity price. The relationship is underscored in the second chart.
When the 12-month futures price is climbing higher relative to the one-month price (shown in the chart as a falling blue line), this incentivizes oil producers to sell forward – contract to deliver oil in a year’s time at the higher commodity price – rather than sell existing physical supply. Forward selling puts downward pressure on the commodity price as inventories climb.
So far in 2019, the blue line on the second chart has been rising, which indicates the 12-month oil futures price has been falling relative to the one-month price. This makes selling of physical oil more attractive to producers, reduces inventories and supports a rising commodity price.
OIL FUTURES CURVE PROVIDES AN
INDICATOR FOR INVENTORY LEVELS
WTI (U.S. $/bbl)
One-month WTI futures price minus 12-month
futures price (right scale)
120
15
100
10
80
5
60
0
-5
40
20
-10
0
-15
2015
2016
2017
2018
‘19
2014
CARRIE COCKBURN / THE GLOBE AND MAIL,
SOURCES: SCOTT BARLOW, BLOOMBERG
OIL FUTURES CURVE PROVIDES AN
INDICATOR FOR INVENTORY LEVELS
WTI (U.S. $/bbl)
One-month WTI futures price minus 12-month
futures price (right scale)
120
15
100
10
80
5
60
0
-5
40
20
-10
0
-15
2015
2016
2017
2018
‘19
2014
CARRIE COCKBURN / THE GLOBE AND MAIL,
SOURCES: SCOTT BARLOW, BLOOMBERG
OIL FUTURES CURVE PROVIDES AN INDICATOR FOR INVENTORY LEVELS
WTI (U.S. $/bbl)
One-month WTI futures price minus 12-month futures price (right)
120
15
100
10
80
5
60
0
-5
40
20
-10
0
-15
2015
2016
2017
2018
‘19
2014
CARRIE COCKBURN / THE GLOBE AND MAIL, SOURCES: SCOTT BARLOW, BLOOMBERG
The EIA’s forecast for inventory builds should be accompanied by a falling blue line on the chart as the one-month futures price falls relative to the 12-month price. This trend would verify a market with excess supply and a weakening crude market.
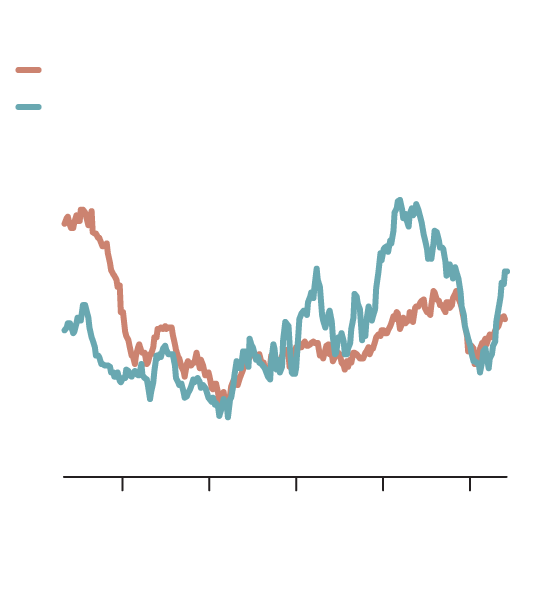
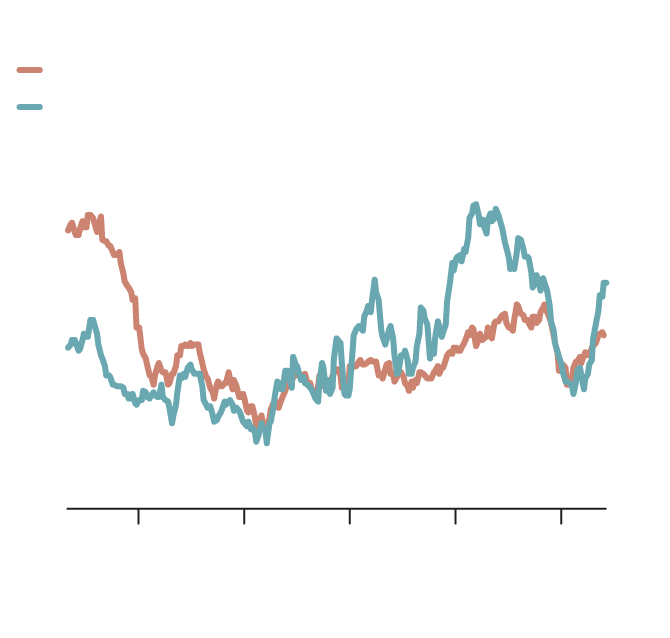
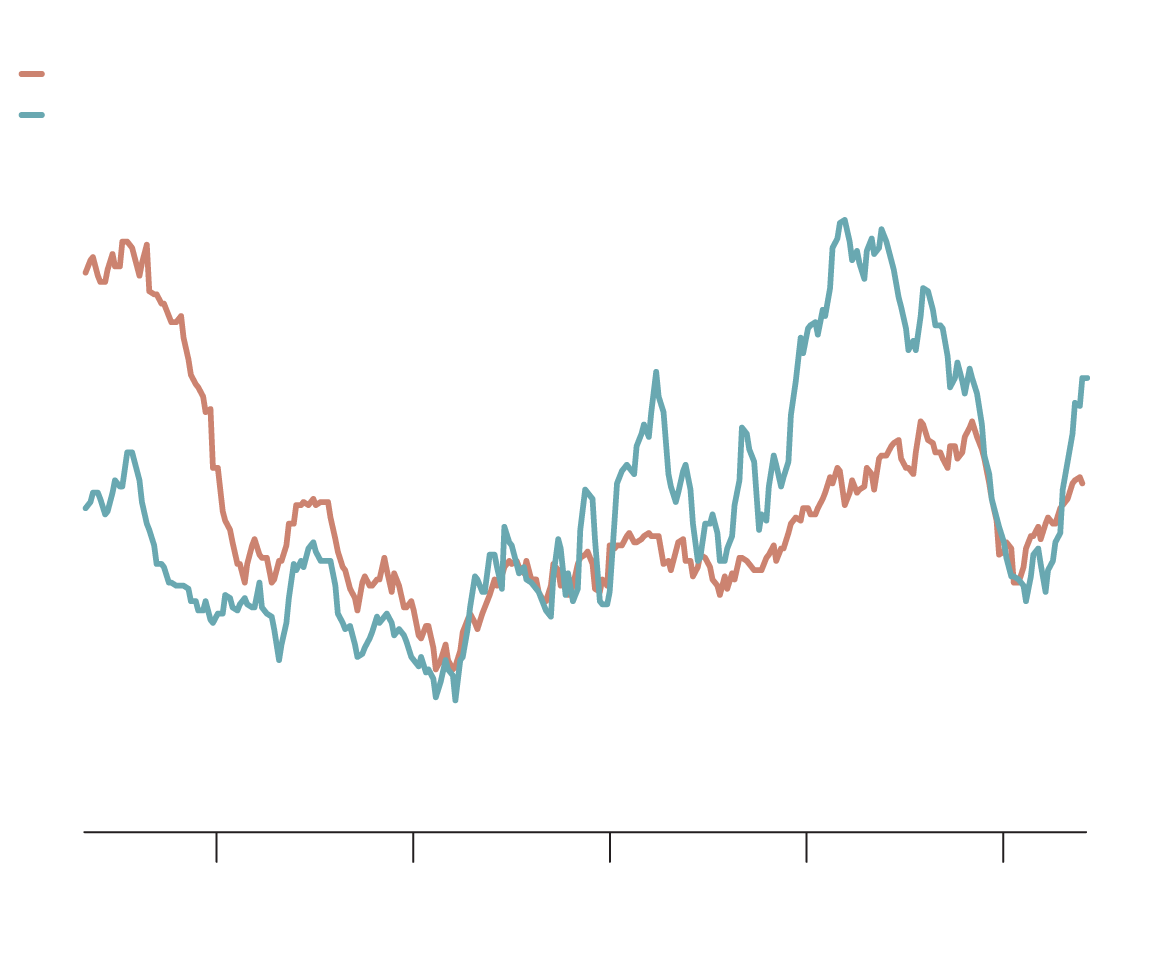
The third and final chart helps explain the oil price’s 6-per-cent slide since April 23. The blue line represents speculative positioning in oil futures markets. Provided weekly by the Commodity Futures Trading Commission (CFTC), the non-commercial net futures position is merely the number of contracts betting on a higher oil price minus those betting on a decline.
A rising line indicates more bullishness among hedge-fund managers. Beginning in June, 2017, and extending to February, 2018, there was a rapid and large build-up in bullish positioning on oil. Beginning in April, 2018, the trend reversed and the decline in optimism is apparent in the falling blue line on the chart.
The scale on the chart is somewhat arbitrary so it’s difficult to make quantitative conclusions. It does appear, however, that when net futures positioning gets substantially above the oil price on the chart, it signals excessive bullishness. The subsequent reversal in optimistic futures bets markets eventually helps push the commodity price lower.
Hedge-fund managers are already reducing bets on a rising crude price. Funds were net sellers of the six major petroleum futures and options contracts in the week to April 30, bringing to an end a record-breaking 15-week run of net purchases, according to Reuters.
The net positioning in futures plotted on the third chart remains well above the crude price. My strong suspicion is that the next few CFTC data releases will also show a significant decline in optimism in futures markets, helping to explain the risk-off mentality that has just recently filtered into the oil market.
That said, none of the charts indicate a major slide in the crude price – merely the need for investor caution as new supply and demand data are released.