
Cars come off the line at Nissan Motor's manufacturing plant in Smyrna, Tenn., on Aug. 23, 2018.WILLIAM DESHAZER/Reuters
A report on global manufacturing activity has provided some relief that the post-lockdown economic recovery is continuing, and this has important implications extending to commodity prices, the Canadian dollar and equity valuations.
The JPMorgan Global Manufacturing Purchasing Managers Index (PMI) features heavily in one of the three charts I’m watching most closely as the world attempts to work clear of the COVID-19 pandemic. The Global Manufacturing PMI is a composite index combining national surveys of manufacturing executives who respond to questions regarding business activity, hiring and new orders for goods.
The most recent update on Thursday showed a mark of 52.3 (a reading of 50 indicates expanding manufacturing activity in month-over-month terms), up from July’s 51.8.
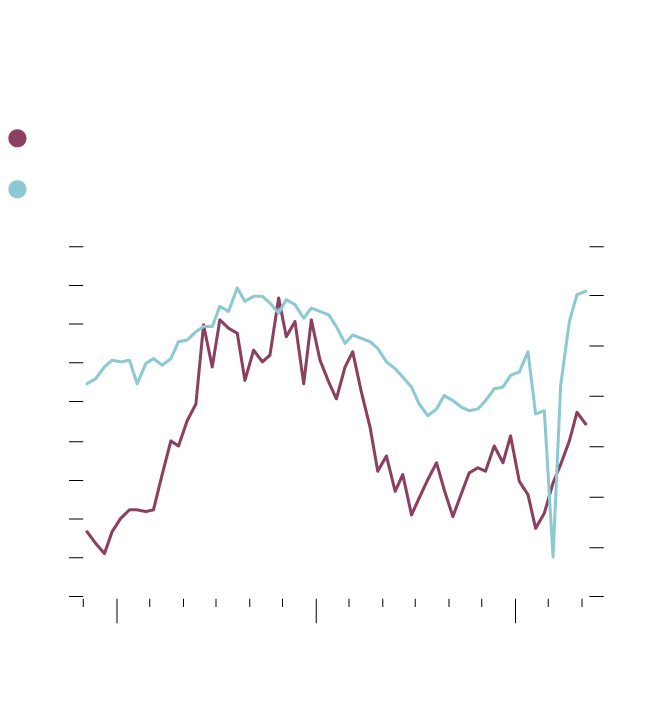
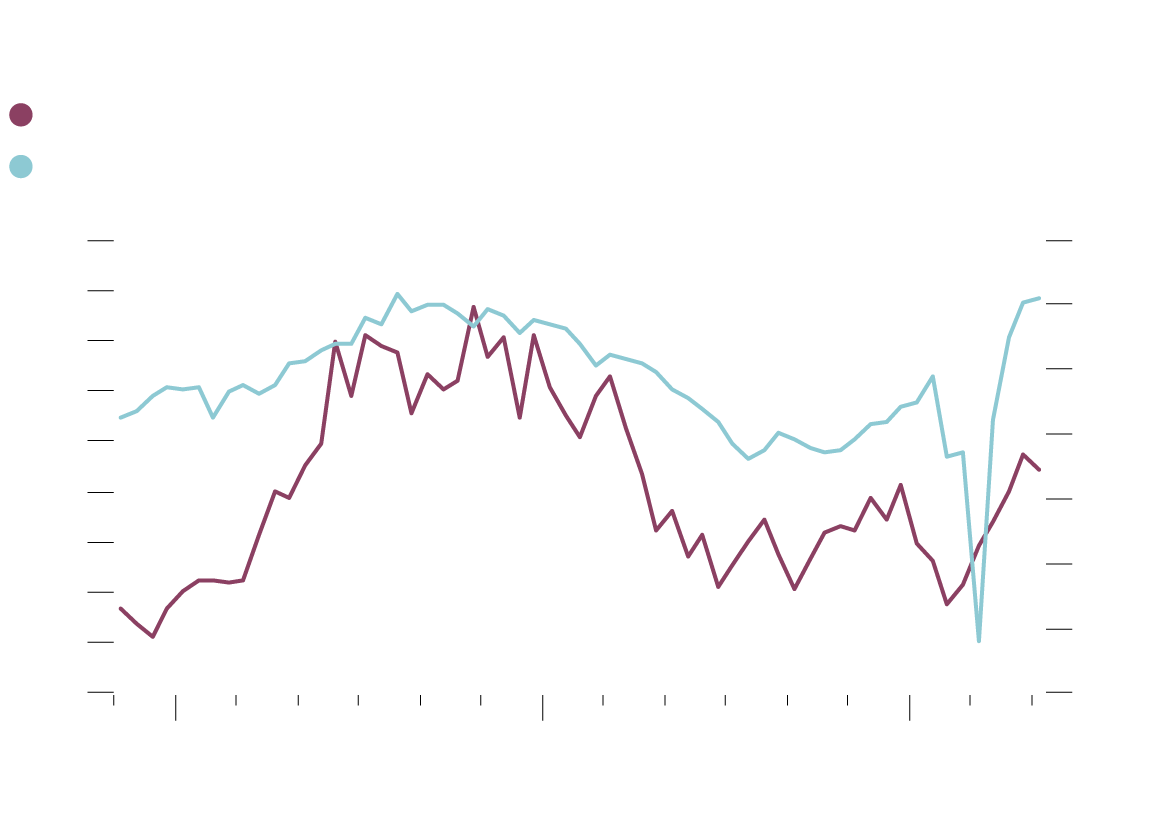
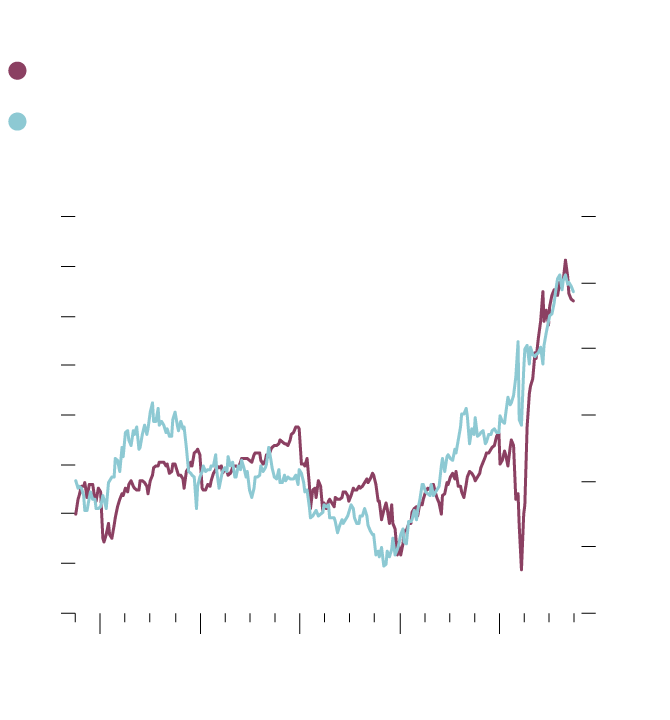
Commodity prices, specifically industrial metals, have closely tracked global manufacturing activity, as the first accompanying chart highlights. China, as the first country to emerge from full quarantine and the source of half the worldwide demand for many major commodities, initiated the recovery for both lines on the chart.
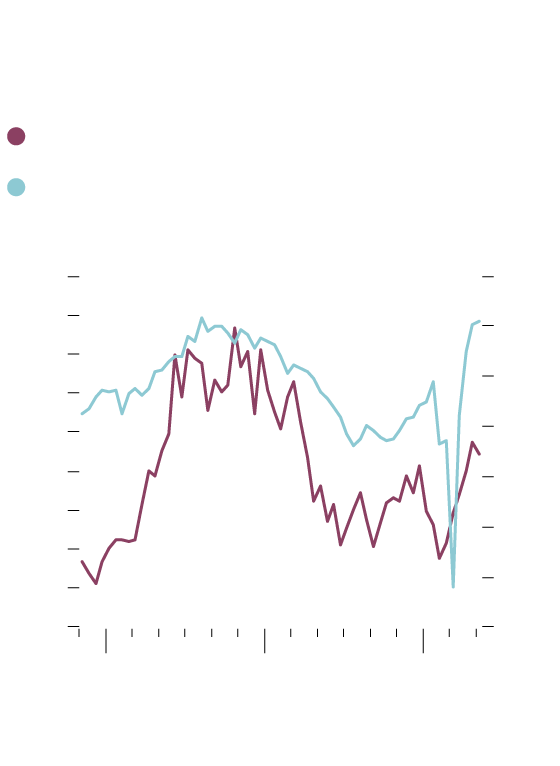
Metals prices, manufacturing:
Key growth barometers
Year-over-year percentage change
S&P GSCI Industrial Metals Index (left scale)
JPM Global Purchasing Managers’ Index
(right scale)
50%
10%
40
5
30
0
20
-5
10
0
-10
-10
-15
-20
-20
-30
-40
-25
2016
2018
2020
THE GLOBE AND MAIL, SOURCE:
SCOTT BARLOW; BLOOMBERG
Metals prices, manufacturing:
Key growth barometers
Year-over-year percentage change
S&P GSCI Industrial Metals Index (left scale)
JPM Global Purchasing Managers’ Index (right scale)
50%
10%
40
5
30
0
20
-5
10
0
-10
-10
-15
-20
-20
-30
-40
-25
2016
2018
2020
THE GLOBE AND MAIL, SOURCE: SCOTT BARLOW; BLOOMBERG
Metals prices, manufacturing: Key growth barometers
Year-over-year percentage change
S&P GSCI Industrial Metals Index (left scale)
JPM Global Purchasing Managers’ Index (right scale)
50%
10%
40
5
30
0
20
-5
10
0
-10
-10
-15
-20
-20
-30
-40
-25
2016
2018
2020
THE GLOBE AND MAIL, SOURCE: SCOTT BARLOW; BLOOMBERG
Prices for industrial metals climbed a remarkable 30 per cent from the market bottom in March to Sept. 1 and have since drifted lower by about 3 per cent.
Commodity prices are highly sensitive to the pace of economic growth. The recent pullback from the peak raised fears that the recovery was slowing but the Global Manufacturing PMI will likely reassure commodity investors to some extent.
Metals prices matter more to Canadians than usual in the current market. The Canadian dollar, which at times has tracked oil prices and the difference between U.S. and Canadian short-term bond yields, has been much more correlated to the copper price in recent months than either of those drivers.
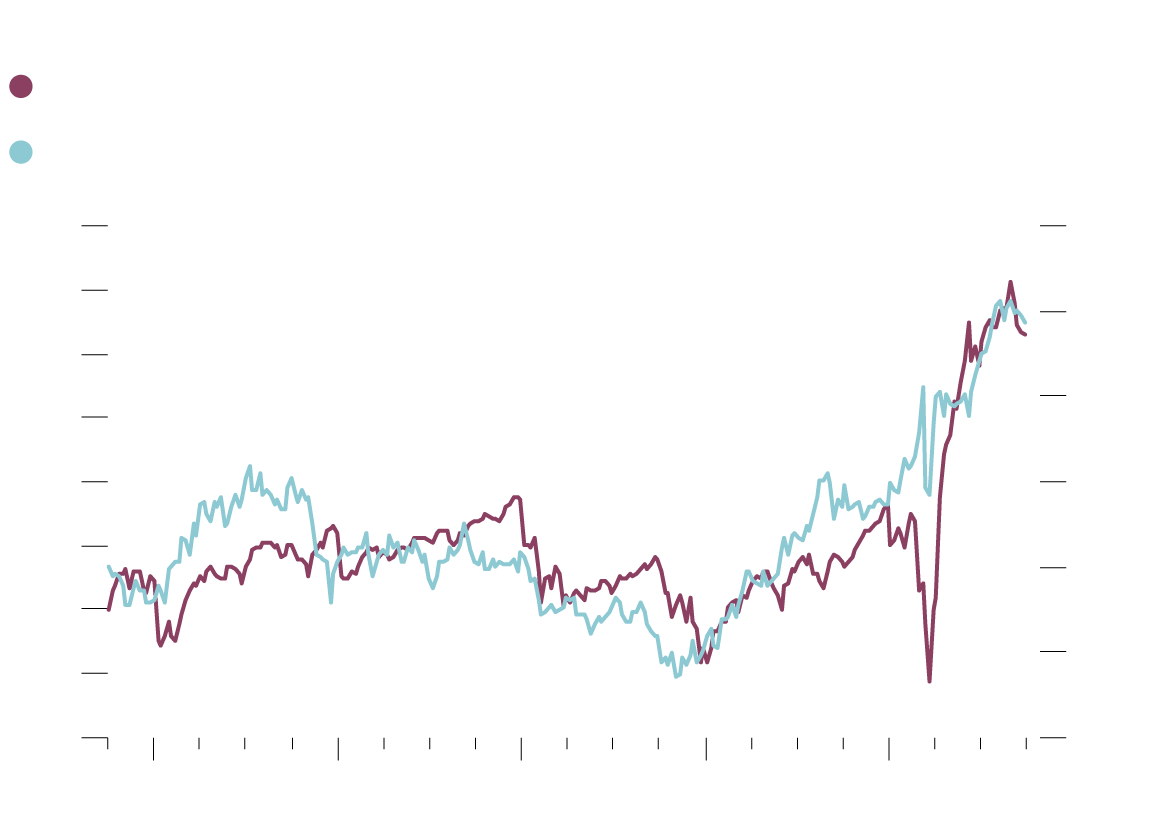
Somewhat paradoxically, there is a specific way in which a stronger-than-expected report on global manufacturing activity is negative for equity markets. Stronger data mean higher inflation pressure and rising inflation-adjusted bond yields as a result.
As we see in the second accompanying chart, the price-to-earnings ratio for the S&P 500 (and thus stock prices) has been moving higher as real bond yields have declined (note that inflation-adjusted bond yields are plotted inversely on the chart to better show the trend).
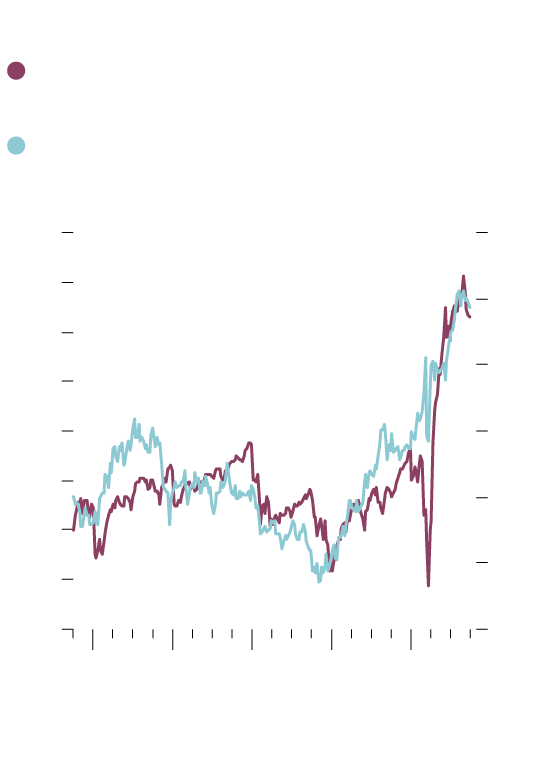
Watching for inflation pressure
S&P 500 forward price-to-earnings ratio
(left scale)
Inflation-adjusted U.S. 10-year bond yields
(right scale, inverted)
28.5
-1.5%
26.5
-1.0
24.5
-0.5
22.5
20.5
0
18.5
0.5
16.5
1.0
14.5
12.5
1.5
2016
2017
2018
2019
2020
THE GLOBE AND MAIL, SOURCE:
SCOTT BARLOW; BLOOMBERG
Watching for inflation pressure
S&P 500 forward price-to-earnings ratio (left scale)
Inflation-adjusted U.S. 10-year bond yields
(right scale, inverted)
28.5
-1.5%
26.5
-1.0
24.5
-0.5
22.5
20.5
0
18.5
0.5
16.5
1.0
14.5
12.5
1.5
2016
2017
2018
2019
2020
THE GLOBE AND MAIL, SOURCE: SCOTT BARLOW; BLOOMBERG
Watching for inflation pressure
S&P 500 forward price-to-earnings ratio (left scale)
Inflation-adjusted U.S. 10-year bond yields (right scale, inverted)
28.5
-1.5%
26.5
-1.0
24.5
-0.5
22.5
20.5
0
18.5
0.5
16.5
1.0
14.5
12.5
1.5
2016
2017
2018
2019
2020
THE GLOBE AND MAIL, SOURCE: SCOTT BARLOW; BLOOMBERG
The premise here is that real bond yields in negative territory, as they are now, makes fixed income far less attractive relative to the expected earnings yield on equities. Investment assets have gravitated from bonds to equities, pushing stock prices higher.
Continued improvement in the economic data would push inflation-adjusted bond yields higher, forming a hurdle for stock prices as bond yields become more attractive.
The third chart I’m watching carefully compares the performance of the conventional, market capitalization-weighted S&P 500 and the equal-weighted S&P 500. In the latter case, each stock in the index counts equally toward performance whereas returns for the conventional benchmark are driven primarily by the largest companies, most of which are currently technology firms.
After the market bottom in March, investor assets flowed to large cap technology stocks where profit growth was more likely than for companies punished by the pandemic. The result was that the market cap weighted index has drastically outperformed the equal weighted index.
If the economic recovery continues, small and medium-sized companies will return to profitability and begin to attract investment assets. These companies, many of which have appealing price-to-earnings ratios owing to investor neglect, should start outperforming mega-cap tech stocks and the equal weighted benchmark will regain ground relative to the S&P 500.
Equity market returns in the coming months will be driven by the strength of the global economic recovery. The global manufacturing index, real bond yields, commodity prices and the equal weighted S&P 500 will all provide investors with the means to assess the economic resurgence.
Be smart with your money. Get the latest investing insights delivered right to your inbox three times a week, with the Globe Investor newsletter. Sign up today.