TransUnion Stock Gains 6% Post Reporting Q4 Earnings & Revenue Beat

TransUnion TRU reported impressive fourth-quarter 2025 results, wherein earnings and revenues beat the Zacks Consensus Estimate.
TRU’s quarterly adjusted EPS (adjusting 55 cents from non-recurring items) of $1.07 surpassed the consensus mark by 3.9%. The metric grew 10.3% year over year. Total revenues of $1.2 billion beat the consensus mark by 3% and rose 13% from the year-ago quarter.
The better-than-expected results impressed the market as the stock gained 5.5% since the release of results on Feb. 12, 2026.
Over the past year, the TRU stock has declined 19.4% compared with the 27.2% fall of the industry it belongs to and against 15.7% growth of the Zacks S&P 500 Composite.
TransUnion Price, Consensus and EPS Surprise
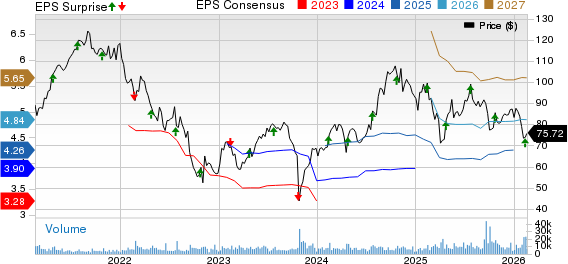
TransUnion price-consensus-eps-surprise-chart | TransUnion Quote
TransUnion’s Revenues by Segments
The U.S. Markets segment’s revenues of $918.9 million increased 16% year over year. It failed to beat the Zacks Consensus Estimate for revenues of $921 million. Within the segment, financial services’ revenues of $423.1 million grew 16% from the year-ago quarter. Emerging vertical revenues were $350 million, up 9% year over year. Consumer Interactive revenues were $145.5 million, up 9% from the year-ago quarter.
The international segment logged revenues of $255.9 million, up 4% from the year-ago quarter. The metric is lower than the consensus mark for revenues of $274.2 million. Within this segment, Canada and Latin America registered $43.5 million and $34.8 million in revenues, increasing 13% and 3% year over year, respectively. On a constant-currency (cc) basis, revenues from Canada rose 13% from the year-ago quarter, while Latin America witnessed a 3% dip. Revenues from the U.K. gained 22% year over year on a reported basis and 18% on a cc basis to $72.2 million.
The Africa and India regions recorded revenues of $19.6 million and $60.4 million, respectively. For Africa, the reported revenue growth rate is 7% year over year and 3% on a cc basis. A 9% year-over-year dip in revenues on a reported basis was recorded for the India region, and a 4% dip was observed on a cc basis. Revenues from the Asia Pacific region were $25.4 million, down 11% year over year on a reported and cc basis.
TRU’s Operating Performance
Adjusted EBITDA was $417 million, marking year-over-year growth of 10% on both reported and cc basis. The adjusted EBITDA margin was 35.6%, down 90 basis points from the year-ago quarter.
For the United States and international market, TRU recorded adjusted EBITDA of $348.5 million and $255.9 million, gaining 12% and 4% year over year on a reported and cc basis, respectively. Adjusted EBITDA from the U.S. market missed the Zacks Consensus Estimate of $349.1 million, while the international market surpassed the consensus mark of $124.8 million.
Balance Sheet & Cash Flow of TRU
TransUnion had $853.6 million in cash and cash equivalents at the end of the quarter compared with $749.9 million at the end of the third quarter of 2025. The long-term debt was $4.9 billion compared with $5 billion in the preceding quarter.
Cash generated from operating activities in the quarter was $319.5 million. Capital expenditure was $96.7 million.
TransUnion’s Q1 & 2026 Outlook
For the first quarter of 2026, TransUnion expects revenues of $1.195-$1.205 billion. The mid-point ($1.2 billion) of the guided range meets the current consensus estimate. TRU expects adjusted EPS between $1.08-$1.10. The guided range is lower than the Zacks Consensus Estimate of $1.14. The guidance for the adjusted EBITDA is kept at $414-$420 million.
For 2026, TransUnion expects revenues of $4.946-$4.981 billion. The mid-point ($4.964 billion) of the guided range is slightly lower than the Zacks Consensus Estimate of $4.97 billion.
TRU expects adjusted EPS of $4.63-$4.71. The guided range is lower than the Zacks Consensus Estimate of $4.85. The adjusted EBITDA outlook is at $1.756-$1.777 billion.
TRU has a Zacks Rank #3 (Hold) at present. You can see the complete list of today’s Zacks #1 Rank (Strong Buy) stocks here.
Earnings Snapshot
IQVIA Holdings Analytics Inc. IQV has reported impressive fourth-quarter 2025 results.
Adjusted earnings were $3.42 per share, surpassing the Zacks Consensus Estimate by a slight margin and gaining 9.6% on a year-over-year basis. Total revenues of $4.4 billion beat the consensus estimate by 2.8% and rose 10.1% from the year-ago quarter.
Equifax Inc. EFX has reported impressive fourth-quarter 2025 results.
EFX posted $2.09 in EPS, beating the Zacks Consensus Estimate by 2.2%. This marked a 1.4% dip from the fourth quarter of 2025. The company recorded $1.6 billion in its top line, surpassing the consensus estimate by 1.3%. Revenues spiked 9.1% from the year-ago quarter’s actual.
Zacks' Research Chief Names "Stock Most Likely to Double"
Our team of experts has just released the 5 stocks with the greatest probability of gaining +100% or more in the coming months. Of those 5, Director of Research Sheraz Mian highlights the one stock set to climb highest.
This top pick is a little-known satellite-based communications firm. Space is projected to become a trillion dollar industry, and this company's customer base is growing fast. Analysts have forecasted a major revenue breakout in 2025. Of course, all our elite picks aren't winners but this one could far surpass earlier Zacks' Stocks Set to Double like Hims & Hers Health, which shot up +209%.
Free: See Our Top Stock And 4 Runners UpWant the latest recommendations from Zacks Investment Research? Today, you can download 7 Best Stocks for the Next 30 Days. Click to get this free report
Equifax, Inc. (EFX): Free Stock Analysis Report
TransUnion (TRU): Free Stock Analysis Report
IQVIA Holdings Inc. (IQV): Free Stock Analysis Report
This article originally published on Zacks Investment Research (zacks.com).
