Dillard's Q2 Earnings Beat on Higher Margins & Tariff Refunds

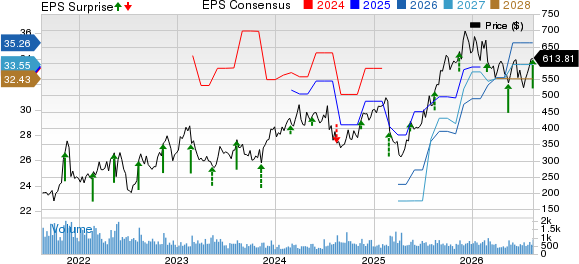
Dillard's Inc.DDS delivered second-quarter fiscal 2026 results, wherein it surpassed the Zacks Consensus Estimate for earnings but fell slightly short on revenues. The company reported second-quarter fiscal 2026 earnings of $6.25 per share, which beat the Zacks Consensus Estimate of $4.04 by 54.7% and increased 34.1% year over year from $4.66.
Net sales declined 0.4% year over year to $1.51 billion and missed the consensus mark of $1.52 billion by 0.7%.
Shares of the Zacks Rank #3 (Hold) company have risen 13.9% in the past three months compared with the industry's 25.9% rally.
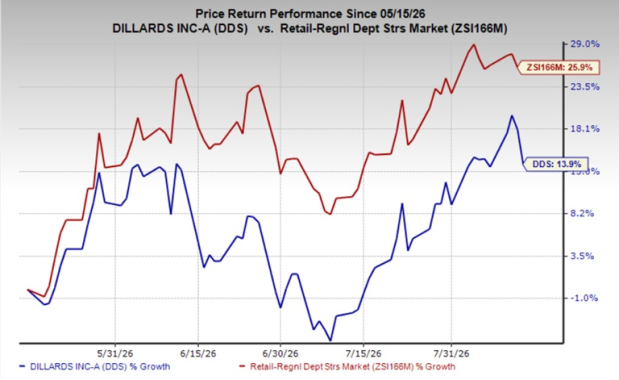
Image Source: Zacks Investment Research
Dillard’s Records Mixed Sales Trends Across Categories
DDS generated total retail sales of $1.455 billion in the fiscal second quarter compared with $1.447 billion in the prior-year quarter. Comparable store sales increased 1% for the same period. Our model had anticipated comps to rise 0.7% for the fiscal second quarter.
Sales growth varied across merchandise categories. Ladies’ accessories and lingerie posted significant increases, while home and furniture delivered moderate growth. Shoes, men’s apparel and accessories, and cosmetics recorded slight increases, whereas juniors’ and children’s apparel and ladies’ apparel declined moderately.
The company continued operating its store network of 272 Dillard’s locations, including 28 clearance centers, across 30 states, along with its internet store.
Dillard's, Inc. Price, Consensus and EPS Surprise
Dillard's, Inc. price-consensus-eps-surprise-chart | Dillard's, Inc. Quote
DDS Sees Margin Gains Drive Profit Growth
Dillard’s posted net income of $97.7 million, up from $72.8 million in the year-ago quarter. The company benefited from a retail gross margin of 40.9% of sales compared with 38.1% in the prior-year period.
The retail gross margin included a positive impact of 260 basis points (bps) from $37.2 million in refunds related to International Emergency Economic Powers Act tariffs. Management does not expect additional significant IEEPA tariff refunds.
The company’s consolidated gross margin improved to 39.7% of sales from 36.6% a year ago. The improvement helped offset higher operating expenses in the period. Our model anticipated a 20-bps expansion in the consolidated gross margin to 36.8%.
DDS Manages Higher Operating Expenses
Dillard’s reported operating expenses (SG&A) of $443.6 million compared with $434.2 million in the year-ago quarter. As a percentage of sales, operating expenses increased 70 bps year over year to 29.4% from 28.7% in the year-ago quarter.
The increase was primarily driven by higher payroll and payroll-related expenses. Despite the cost pressure, stronger merchandise margins supported profitability and helped the company expand net income.
We had expected a 130-bps increase in operating expenses, as a percentage of sales.
Dillard’s Expands Cash Position & Reduces Debt
DDS ended the quarter with cash and cash equivalents of $763.1 million, and short-term investments of $497.7 million. The company also reported merchandise inventories of $1.28 billion, up from $1.22 billion a year ago.
The company paid off $96 million in debt in the first half of fiscal 2026. Long-term debt stood at $145.7 million at the end of the quarter compared with $225.6 million in the prior-year period.
Stockholders’ equity increased to $2.12 billion from $1.92 billion a year ago. The stronger balance sheet provides additional financial flexibility as the company continues its operations and capital investments.
DDS Maintains FY26 Financial Outlook
Dillard’s maintained its fiscal 2026 outlook for certain financial statement items. The company expects depreciation and amortization of $175 million, rentals of $18 million, and net interest and debt income of $9 million for the 52 weeks ending Jan. 30, 2027.
Capital expenditure is projected to be $120 million for fiscal 2026, whereas it reported $93 million in fiscal 2025. The company continues to evaluate spending plans based on current operating conditions.
Key Picks in the Retail Space
Macy's Inc.M is an omnichannel retail organization operating stores, websites and mobile applications under three nameplates: Macy’s, Bloomingdale’s and Bluemercury. The company currently carries a Zacks Rank #2 (Buy). You can see the complete list of today’s Zacks #1 Rank (Strong Buy) stocks here.
The Zacks Consensus Estimate for Macy's current financial-year sales and earnings indicates a decline of 0.01% and 5.6%, respectively, from the year-ago numbers. Macy's delivered a trailing four-quarter earnings surprise of 211%, on average.
Urban Outfitters Inc.URBN is a lifestyle products and services company that sells fashion apparel, accessories, footwear, home goods and related offerings through a portfolio of global consumer brands. The company currently carries a Zacks Rank of 2.
The Zacks Consensus Estimate for Urban Outfitters’ current financial-year sales and earnings indicates growth of 8.8% and 12.7%, respectively, from the year-ago reported numbers. URBN delivered a trailing four-quarter earnings surprise of 12.2%, on average.
Boot Barn Holdings, Inc.BOOT is the largest lifestyle retailer in the United States, specializing in western and work-related footwear, apparel and accessories. The company currently carries a Zacks Rank of 2.
The Zacks Consensus Estimate for Boot Barn’s current financial-year sales and earnings is expected to rise 15.7% and 22.6%, respectively, from the year-ago reported figures. BOOT delivered a trailing four-quarter earnings surprise of 11.4%, on average.
7 Best Stocks for the Next 30 Days
Just released: Experts distill 7 elite stocks from the current list of 220 Zacks Rank #1 Strong Buys. They deem these tickers "Most Likely for Early Price Pops."
Since 1988, the full list has beaten the market more than 2X over with an average gain of +23.9% per year. So be sure to give these hand picked 7 your immediate attention.
See them now >>This article originally published on Zacks Investment Research (zacks.com).
