Key Points
The Dow Jones Industrial Average, S&P 500, and Nasdaq Composite have delivered outsize returns during Trump's tenure in the White House.
Donald Trump's tariff and trade policy takes a back seat to two catalysts that can trigger a stock market crash.
Federal Reserve credibility and historically pricey stock valuations loom large in 2026.
From a purely statistical standpoint, Wall Street has been pleased with Donald Trump's tenure in the White House.
Although the stock market has endured some of its wildest historical swings under President Trump (e.g., the five-week COVID-19 crash and a one-week swoon in early April 2025), the Dow Jones Industrial Average(DJINDICES: ^DJI), S&P 500(SNPINDEX: ^GSPC), and Nasdaq Composite(NASDAQINDEX: ^IXIC) gained 57%, 70%, and 142%, respectively, during his first term, and have all rallied by 13% to 15% since his second, non-consecutive term began (as of the end of February 2026).
Will AI create the world's first trillionaire? Our team just released a report on the one little-known company, called an "Indispensable Monopoly" providing the critical technology Nvidia and Intel both need. Continue »
The argument can be made that things have been too good to be true for the stock market since Trump took office -- and that's generally worrisome. Oftentimes, when things seem too perfect for stocks, they are.
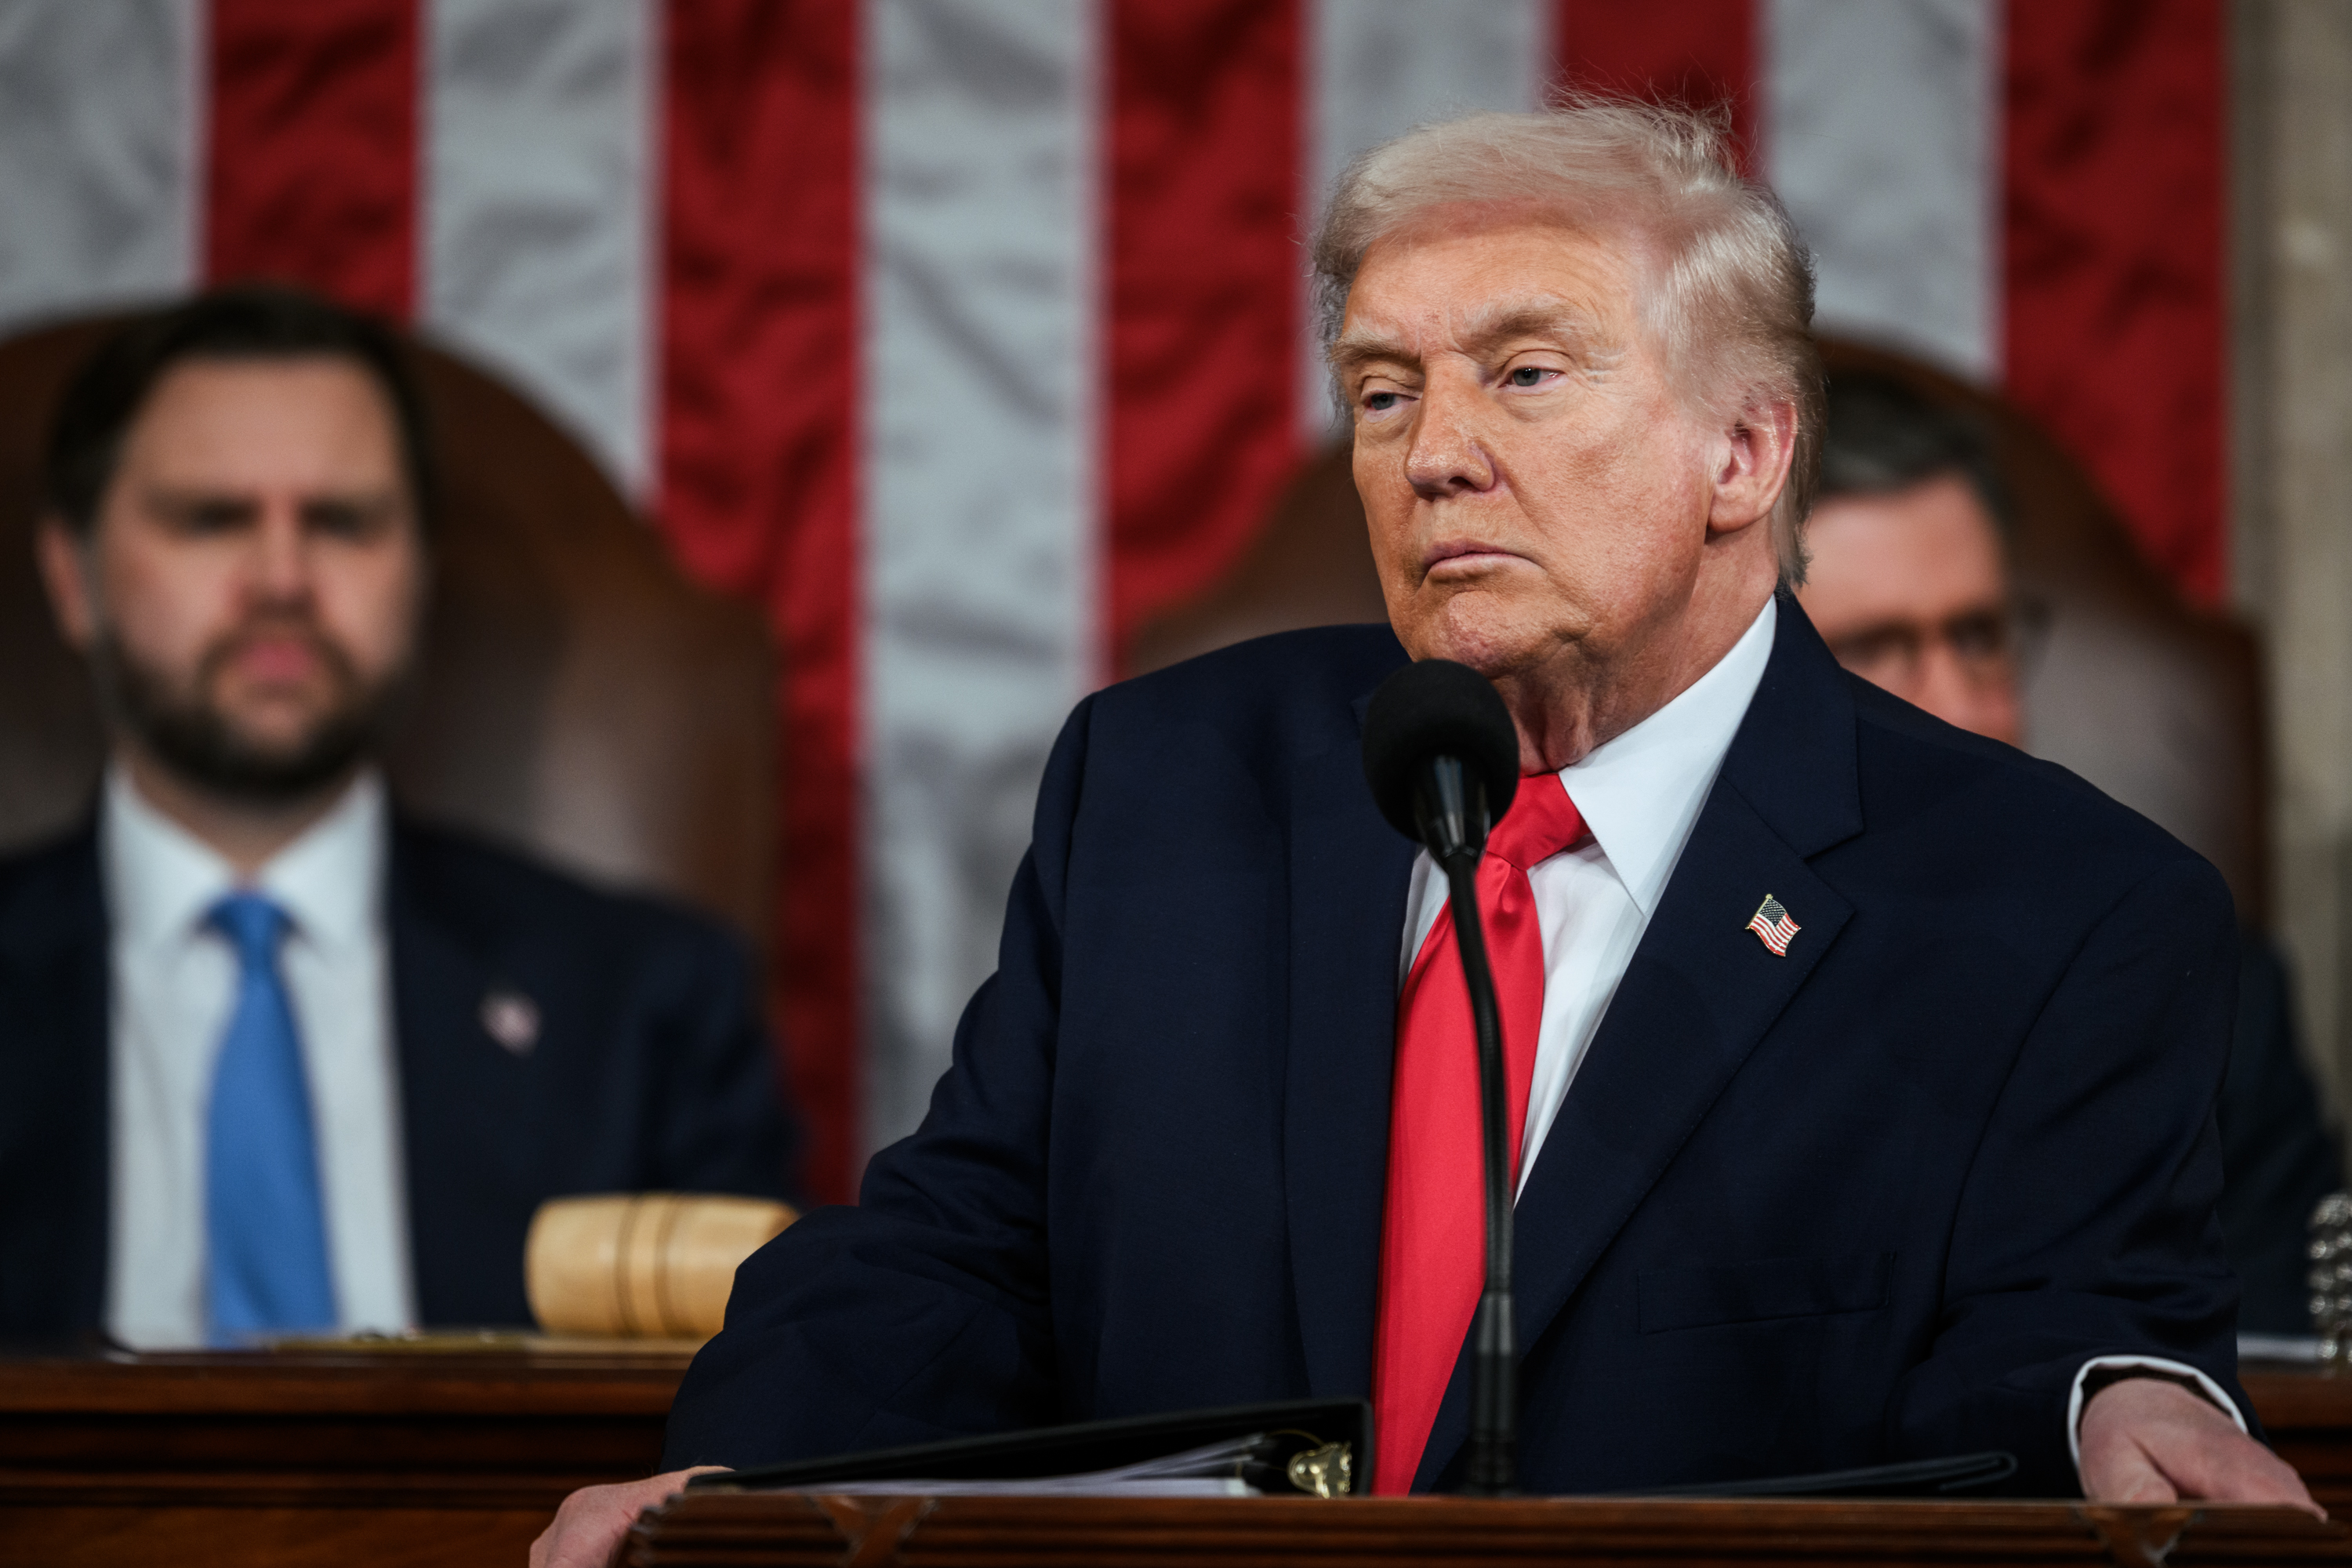
President Trump delivering the State of the Union address. Image source: Official White House Photo by Daniel Torok.
For instance, it's easy for investors to scapegoat President Trump's ever-evolving tariff and trade policy as a catalyst that could potentially pull the rug out from beneath the Dow, S&P 500, and Nasdaq Composite. Prior studies by four New York Federal Reserve economists have shown that Trump's tariffs have adversely affected American businesses and publicly traded companies.
But tariffs aren't Wall Street's biggest concern. While the president's trade policy tends to dominate headlines, there are two more sinister factors that dwarf its relevance and are far likelier to trigger a potential stock market crash under Donald Trump.
A possible loss of credibility for the Federal Reserve looms large
Arguably, the stock market's biggest problem is the Federal Reserve.
Usually, the nation's central bank is a steady force on Wall Street. The Fed attempts to achieve its goals of maximizing employment and stabilizing prices by adjusting the federal funds target rate (the overnight lending rate between financial institutions) and through open-market operations, such as buying or selling U.S. Treasury bonds. The 12 members of the Federal Open Market Committee (FOMC), which currently includes Fed Chair Jerome Powell, oversee the nation's monetary policy and are responsible for these changes.
The first issue is that we've been witnessing a historic level of division within the FOMC. Although Powell has had the lowest dissent rate among any Fed chair since 1978, the rift among the FOMC's voting members has seemingly widened in recent months.
Anna is correct below when she says:
-- Jim Bianco (@biancoresearch) September 17, 2025
"I have not seen a meeting with so much contradictions."
---
This meeting was a mess.
See the labels in the dot plot below.
One member of the FOMC thinks the Fed is going to HIKE rates this year. One (Stephen Miran) thinks it is going to cut... https://t.co/TRUQmD5I2Epic.twitter.com/qPlJGL57ln
There's been at least one dissent in each of the last five meetings, with the October and December FOMC meetings featuring dissents in opposite directions. While the FOMC voted in favor of 25-basis-point reductions to the federal funds target rate on both occasions, at least one member favored no cut, while another pushed for a more aggressive 50-basis-point reduction.
Though monetary policy discussion among FOMC members is widely viewed as constructive, the lack of a cohesive vision is worrisome for investors.
The other notable Federal Reserve problem is that Powell's term as Fed chair ends on May 15. This is what prompted President Trump to nominate former Fed Governor Kevin Warsh to succeed him.
Putting aside the uncertainties of whether Warsh has the requisite votes from the Senate Banking Committee and U.S. Senate to earn the position, there are concerns that Warsh's nomination could come back to bite Wall Street.
"If Trump wants someone easy on inflation, he got the wrong guy in Kevin Warsh."@AnnaEconomistpic.twitter.com/FGMfeSqHpU
-- Daily Chartbook (@dailychartbook) January 31, 2026
Historically, Warsh has been hawkish. During the financial crisis (Warsh served on the FOMC from Feb. 24, 2006, to March 31, 2011), he often favored keeping interest rates higher to prevent inflation from becoming problematic. Meanwhile, investors have essentially factored in further rate cuts.
What's more, Warsh has strongly critiqued the Fed's balance sheet, which holds approximately $6.6 trillion in assets -- mostly U.S. Treasury bonds and mortgage-backed securities (MBSs). If Warsh were to get his wish and the central bank deleveraged its balance sheet, the selling of bonds and MBSs could drive up long-term yields, potentially raising borrowing costs and mortgage rates.
The Fed is at a crossroads in 2026, and it wouldn't take much for a loss of credibility in the nation's central bank to tip Wall Street into a possible elevator-down move.
Image source: Getty Images.
A historically pricey stock market pulls the rug out from beneath investors
The other nefarious factor that can send the Dow Jones Industrial Average, S&P 500, and Nasdaq Composite over the edge is stock valuations.
To preface the following discussion, value is inherently subjective. Since there's no one-size-fits-all way to evaluate and value companies or the broader market, it's virtually impossible to forecast short-term directional moves in individual stocks or indexes with any long-term accuracy.
Nevertheless, one time-tested valuation tool has consistently sliced through this subjectivity and objectively foreshadowed potential stock market crashes on Wall Street.
The Shiller Price-to-Earnings (P/E) Ratio, also known as the Cyclically Adjusted P/E Ratio (CAPE Ratio), was introduced in the late 1980s by economists, but has since been back-tested to January 1871. What separates the Shiller P/E from the popular P/E ratio is that it uses 10 years of average, inflation-adjusted earnings history rather than just 12 months of trailing earnings. This ensures that recessions and shock events won't render the CAPE Ratio useless.
S&P 500 Shiller PE Ratio hits 2nd highest level in history 🚨 The highest was the Dot Com Bubble 🤯 pic.twitter.com/Lx634H7xKa
-- Barchart (@Barchart) December 28, 2025
Over the last 155 years, the Shiller P/E has averaged a little over 17.3. But since October 2025, it's been hovering between 39 and 41, marking the second-priciest stock market in history, behind only the dot-com bubble.
To be clear, the CAPE Ratio isn't a timing tool and won't alert investors to the start of a stock market correction or crash event. However, it does have a perfect track record of foreshadowing significant declines in the Dow, S&P 500, and Nasdaq Composite.
The Shiller P/E has only topped 30 during a continuous bull market on six occasions since 1871, including the present. Following the previous five instances, the Dow, S&P 500, or Nasdaq Composite shed 20% to 89% of their value. This includes drops of 49% and 78% for the S&P 500 and the Nasdaq, respectively, when the dot-com bubble burst, and 89% for the Dow during the Great Depression.
History also teaches us that no bear market has ended with the Shiller P/E higher than 27. If this were to hold true, yet again, the benchmark S&P 500 would be expected to shed at least a third of its value, with the growth-focused Nasdaq likely falling even more.
Though history can't guarantee what's to come, the Shiller P/E has an uncanny track record of being right. If so, unsustainably high stock valuations, and not President Trump's tariffs, are more likely to incite a stock market crash on Wall Street.
Should you buy stock in S&P 500 Index right now?
Before you buy stock in S&P 500 Index, consider this:
The Motley Fool Stock Advisor analyst team just identified what they believe are the 10 best stocks for investors to buy now… and S&P 500 Index wasn’t one of them. The 10 stocks that made the cut could produce monster returns in the coming years.
Consider when Netflix made this list on December 17, 2004... if you invested $1,000 at the time of our recommendation, you’d have $534,817!* Or when Nvidia made this list on April 15, 2005... if you invested $1,000 at the time of our recommendation, you’d have $1,123,912!*
Now, it’s worth noting Stock Advisor’s total average return is 964% — a market-crushing outperformance compared to 192% for the S&P 500. Don't miss the latest top 10 list, available with Stock Advisor, and join an investing community built by individual investors for individual investors.
*Stock Advisor returns as of March 7, 2026.
Sean Williams has no position in any of the stocks mentioned. The Motley Fool has no position in any of the stocks mentioned. The Motley Fool has a disclosure policy.
