The Canadian dollar’s surprising resilience in the face of this week’s crude price collapse had global foreign exchange traders scratching their heads and sending me messages with language not suitable for The Globe and Mail. For the time being, it appears the value of the loonie is ignoring the storage-related dislocations in the energy market and tracking hopes for a global economic recovery as represented by the copper price.
The Canadian dollar has been fickle in the post-financial-crisis period. For five years ending with the first quarter of 2018, its value was almost completely correlated with the difference between the central-bank-driven two-year government bond yields domestically and in the United States. That relationship has now completely fallen apart, to the point where I’m not publishing the chart here.
On March 17, I wrote a column titled Canadian Dollar Sinking: The Petro-loonie Resurfaces at Exactly the Wrong Time, outlining the then-close relationship between the Canadian dollar and the falling oil price. This week, however, the value of the domestic currency is well above where the oil price says it should be.
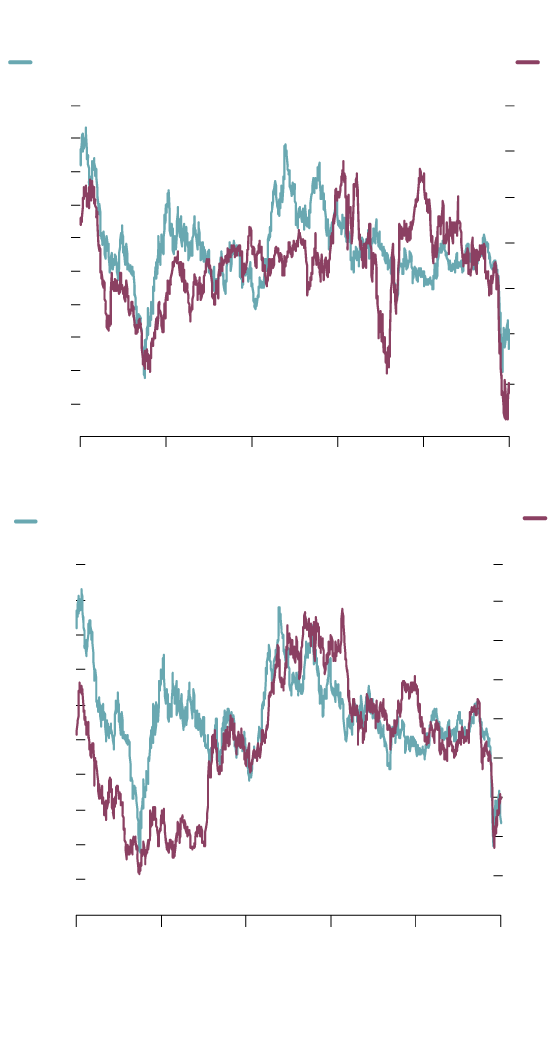
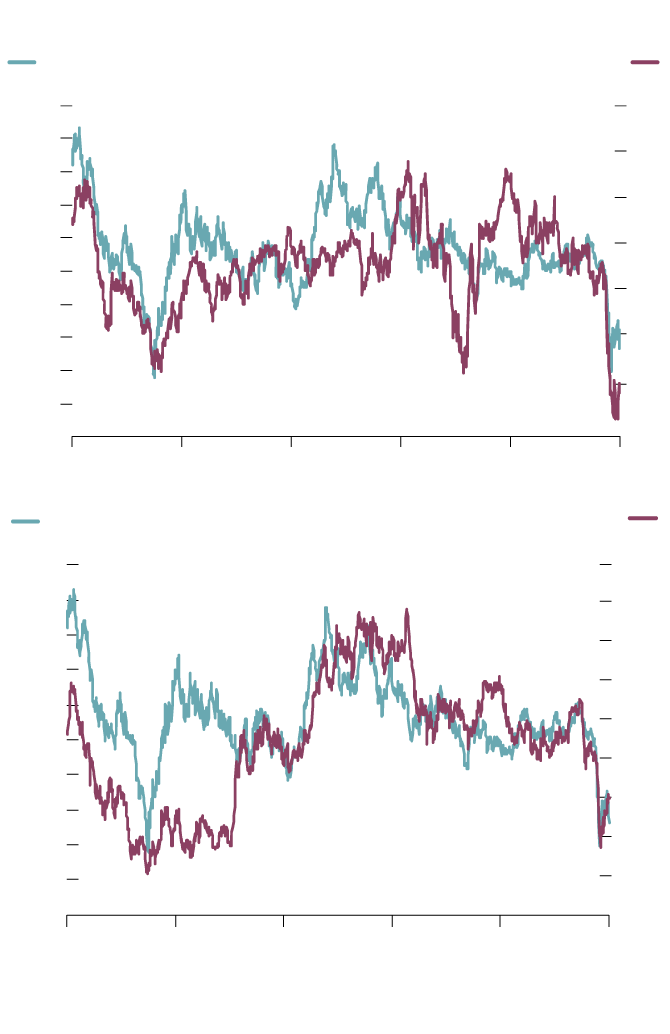
The first accompanying chart compares the Canadian dollar with the domestic oil price, Western Canadian Select. The relationship is sometimes on – such as between April, 2015, and April, 2017 – and sometimes off, such as from June, 2017 to mid-2019. More recently, the loonie and the oil price were highly correlated from October, 2019, until this week.
The large divergence between the loonie (blue line) and oil (purple line) at the end of the chart highlights the Canadian dollar’s ability to resist the full negative effects of this week’s swoon in crude prices.
Oil vs. copper: Gauging global economic health
CAD/USD
Western Canada Select
crude (US$/barrel)
$0.85
$70
0.83
60
0.81
50
0.79
0.77
40
0.75
30
0.73
0.71
20
0.69
10
0.67
0.65
0
04-21-2015
04-21-2017
04-21-2019
3-month copper futures (US$/lb)
CAD/USD
$0.85
$3.55
0.83
3.35
0.81
3.15
0.79
2.95
0.77
2.75
0.75
2.55
0.73
2.35
0.71
2.15
0.69
1.95
0.67
0.65
1.75
04-21-2015
04-21-2017
04-21-2019
JOHN SOPINSKI/THE GLOBE AND MAIL
SOURCE: scott barlow; bloomberg
Oil vs. copper: Gauging global economic health
CAD/USD
Western Canada Select crude (US$/barrel)
$0.85
$70
0.83
60
0.81
50
0.79
0.77
40
0.75
30
0.73
0.71
20
0.69
10
0.67
0.65
0
04-21-2015
04-21-2017
04-21-2019
Three-month copper futures (US$/lb)
CAD/USD
$0.85
$3.55
0.83
3.35
0.81
3.15
0.79
2.95
0.77
2.75
0.75
2.55
0.73
2.35
0.71
2.15
0.69
1.95
0.67
0.65
1.75
04-21-2015
04-21-2017
04-21-2019
JOHN SOPINSKI/THE GLOBE AND MAIL
SOURCE: scott barlow; bloomberg

Oil vs. copper: Gauging global economic health
CAD/USD
Western Canada Select crude (US$/barrel)
$0.85
$70
0.83
60
0.81
50
0.79
0.77
40
0.75
30
0.73
0.71
20
0.69
10
0.67
0.65
0
04-21-2015
04-21-2016
04-21-2017
04-21-2018
04-21-2019
04-21-2020
Three-month copper futures (US$/lb)
CAD/USD
$0.85
$3.55
0.83
3.35
0.81
3.15
0.79
2.95
0.77
2.75
0.75
2.55
0.73
2.35
0.71
2.15
0.69
1.95
0.67
0.65
1.75
04-21-2015
04-21-2016
04-21-2017
04-21-2018
04-21-2019
04-21-2020
JOHN SOPINSKI/THE GLOBE AND MAIL, SOURCE: scott barlow; bloomberg
The second chart might provide an explanation for the currency’s relative buoyancy. It tracks the relationship between the loonie and the price of three-month copper futures.
The correlation between the loonie and the copper price has been consistently higher than for the loonie and oil since November, 2016. In 2020, the fall in the loonie has been proportionate to the decline in the copper price whereas the Canadian dollar has fallen not nearly as much as the oil price on the first chart would indicate.
The copper price has been, and remains, a better indicator for the value of the loonie – the question is why.
The most likely answer is that, compared with oil, copper is a better proxy for hopes of a global economic recovery that would benefit Canada’s open, trade-oriented economy. Crude prices have been a poorer barometer of global economic growth. The oil price has been affected by a number of non-economic factors, most notably Saudi Arabia’s decision in March to flood the market after talks designed to curb global production fell apart.
The recent shortage of storage facilities is another example of largely non-economic issues creating energy price dislocations. The storage shortage was caused by cratering demand as the global economy slows, yes, but if more storage were available, the May futures price would not have collapsed into negative territory on Monday.
Trading in copper markets has been far more orderly by comparison, providing a clearer indication of global business activity. Importantly, the partial recovery in copper prices and the loonie coincides with better than expected trade data from China – the country that consumes almost half of all copper produced worldwide.
The loonie has been tough to figure out – lining up with oil, copper or bond yields at different times over the past few years. For now, however, it appears that copper prices provide the best indicator for the Canadian dollar’s value.
Scott Barlow is the in-house market strategist at Report on Business.