Chubb (NYSE:CB) Exceeds Q1 CY2026 Expectations


Global insurance provider Chubb Limited (NYSE:CB) announced better-than-expected revenue in Q1 CY2026, with sales up 11.9% year on year to $15.3 billion. Its non-GAAP profit of $6.82 per share was 3.2% above analysts’ consensus estimates.
Is now the time to buy Chubb? Find out by accessing our full research report, it’s free.
Chubb (CB) Q1 CY2026 Highlights:
- Net Premiums Earned: $13.46 billion vs analyst estimates of $13.12 billion (12.1% year-on-year growth, 2.6% beat)
- Revenue: $15.3 billion vs analyst estimates of $14.61 billion (11.9% year-on-year growth, 4.7% beat)
- Combined Ratio: 84% vs analyst estimates of 84.9% (90 basis point beat)
- Adjusted EPS: $6.82 vs analyst estimates of $6.61 (3.2% beat)
- Book Value per Share: $189.93 vs analyst estimates of $206.98 (15.8% year-on-year growth, 8.2% miss)
- Market Capitalization: $127.9 billion
Evan G. Greenberg, Chairman and Chief Executive Officer of Chubb Limited, commented: "We had an excellent quarter and start to the year, which speaks to the strength and resilience of our company in a period of elevated uncertainty. Our globally diversified business, underwriting discipline and strong balance sheet contribute to our returns while creating continued opportunities for growth.
Company Overview
Dating back to when a Civil War veteran created a frost-proof water meter, Chubb Limited (NYSE:CB) provides commercial and personal property and casualty insurance, reinsurance, and life insurance products to a diverse client base across 54 countries.
Revenue Growth
In general, insurance companies earn revenue from three primary sources. The first is the core insurance business itself, often called underwriting and represented in the income statement as premiums earned. The second source is investment income from investing the “float” (premiums collected upfront not yet paid out as claims) in assets such as fixed-income assets and equities. The third is fees from various sources such as policy administration, annuities, or other value-added services. Luckily, Chubb’s revenue grew at an impressive 10.6% compounded annual growth rate over the last five years. Its growth beat the average insurance company and shows its offerings resonate with customers.
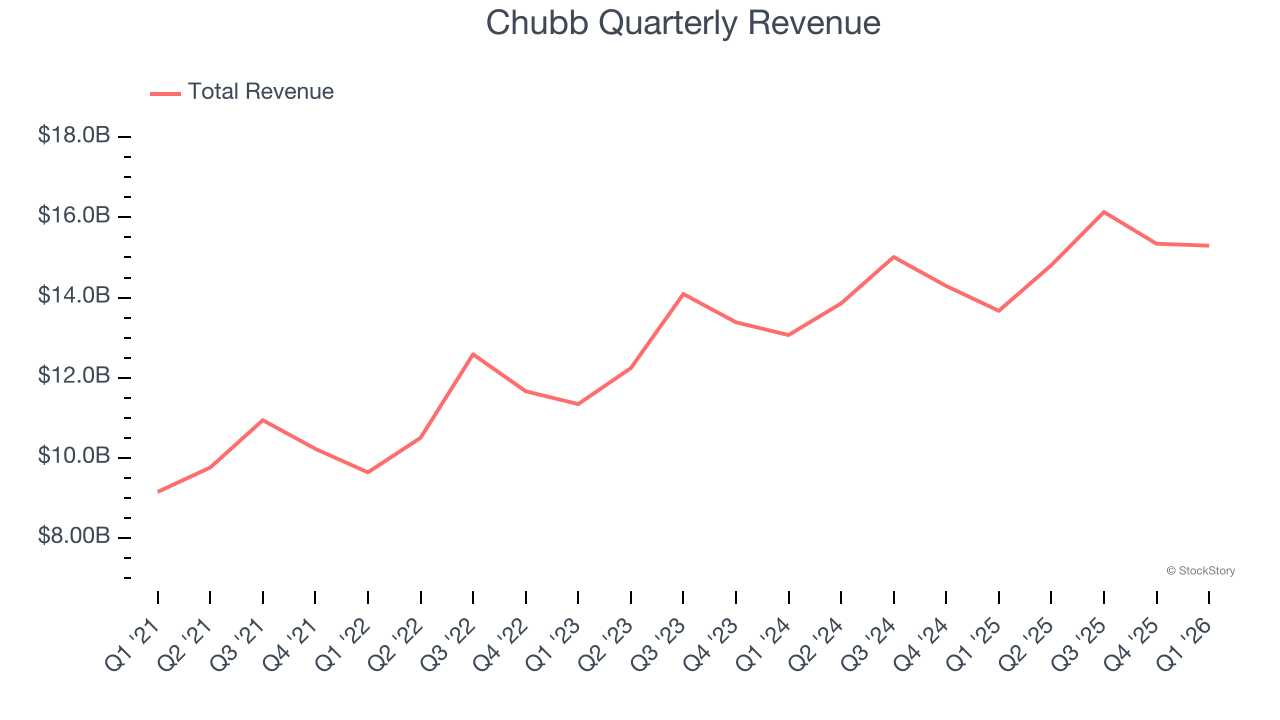
Long-term growth is the most important, but within financials, a half-decade historical view may miss recent interest rate changes and market returns. Chubb’s annualized revenue growth of 8% over the last two years is below its five-year trend, but we still think the results were respectable. 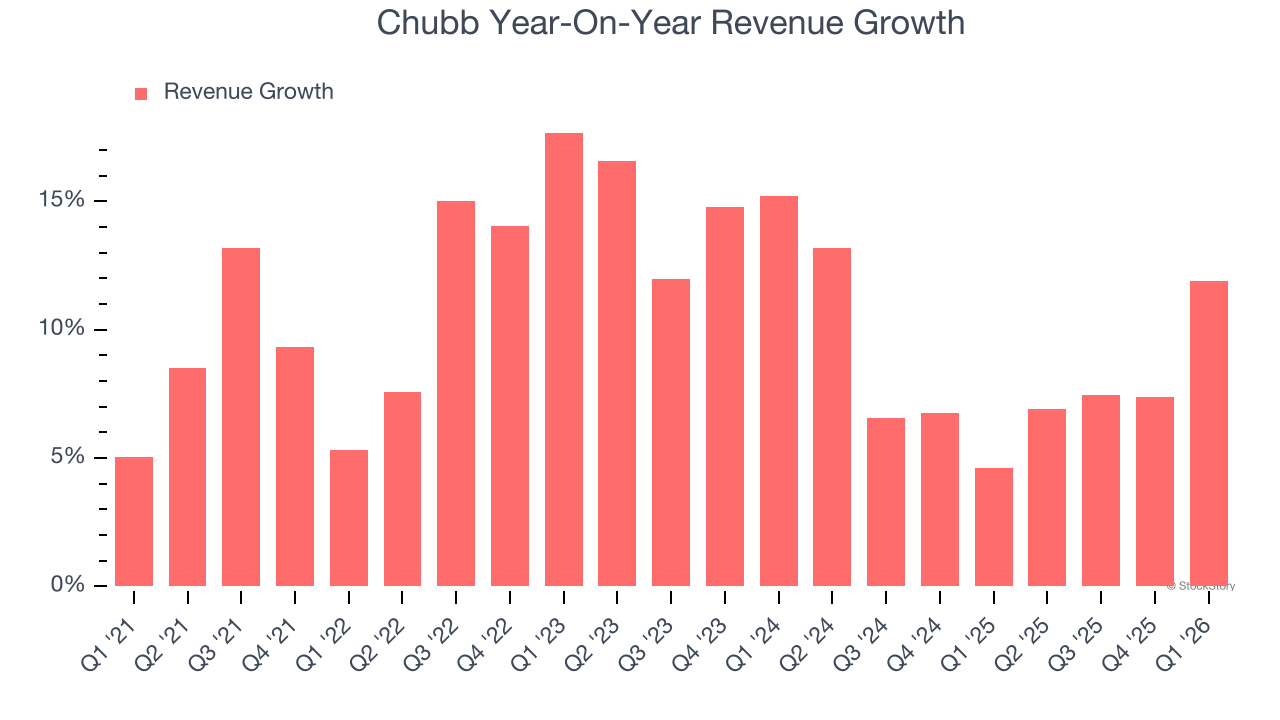
This quarter, Chubb reported year-on-year revenue growth of 11.9%, and its $15.3 billion of revenue exceeded Wall Street’s estimates by 4.7%.
Net premiums earned made up 89.4% of the company’s total revenue during the last five years, meaning Chubb barely relies on non-insurance activities to drive its overall growth.
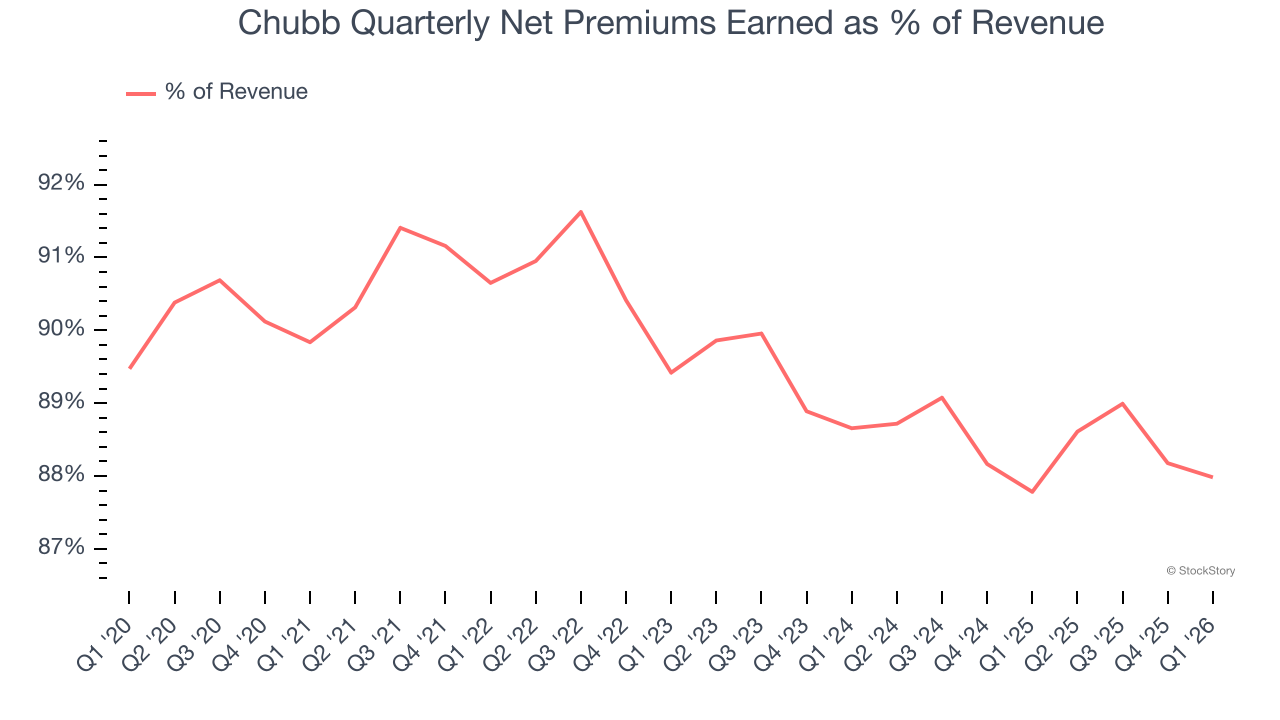
Our experience and research show the market cares primarily about an insurer’s net premiums earned growth as investment and fee income are considered more susceptible to market volatility and economic cycles.
ONE MORE THING: 3 Hidden Platforms Growing 3X Faster than Amazon, Google, and PayPal. Amazon, Google, and Meta all followed the same playbook: Dominate an ignored market. Build an unbeatable moat. Scale until you’re unstoppable.
These three platforms are running that exact playbook right now. The early investors in Amazon made fortunes. The early investors in these could do the same. Get All 3 Stocks Here for FREE.
Book Value Per Share (BVPS)
Insurance companies are balance sheet businesses, collecting premiums upfront and paying out claims over time. The float – premiums collected but not yet paid out – are invested, creating an asset base supported by a liability structure. Book value captures this dynamic by measuring:
- Assets (investment portfolio, cash, reinsurance recoverables) - liabilities (claim reserves, debt, future policy benefits)
BVPS is essentially the residual value for shareholders.
We therefore consider BVPS very important to track for insurers and a metric that sheds light on business quality. While other (and more commonly known) per-share metrics like EPS can sometimes be lumpy due to reserve releases or one-time items and can be managed or skewed while still following accounting rules, BVPS reflects long-term capital growth and is harder to manipulate.
Chubb’s BVPS grew at a decent 7.7% annual clip over the last five years. BVPS growth has accelerated recently, growing by 12.9% annually over the last two years from $149.09 to $189.93 per share.
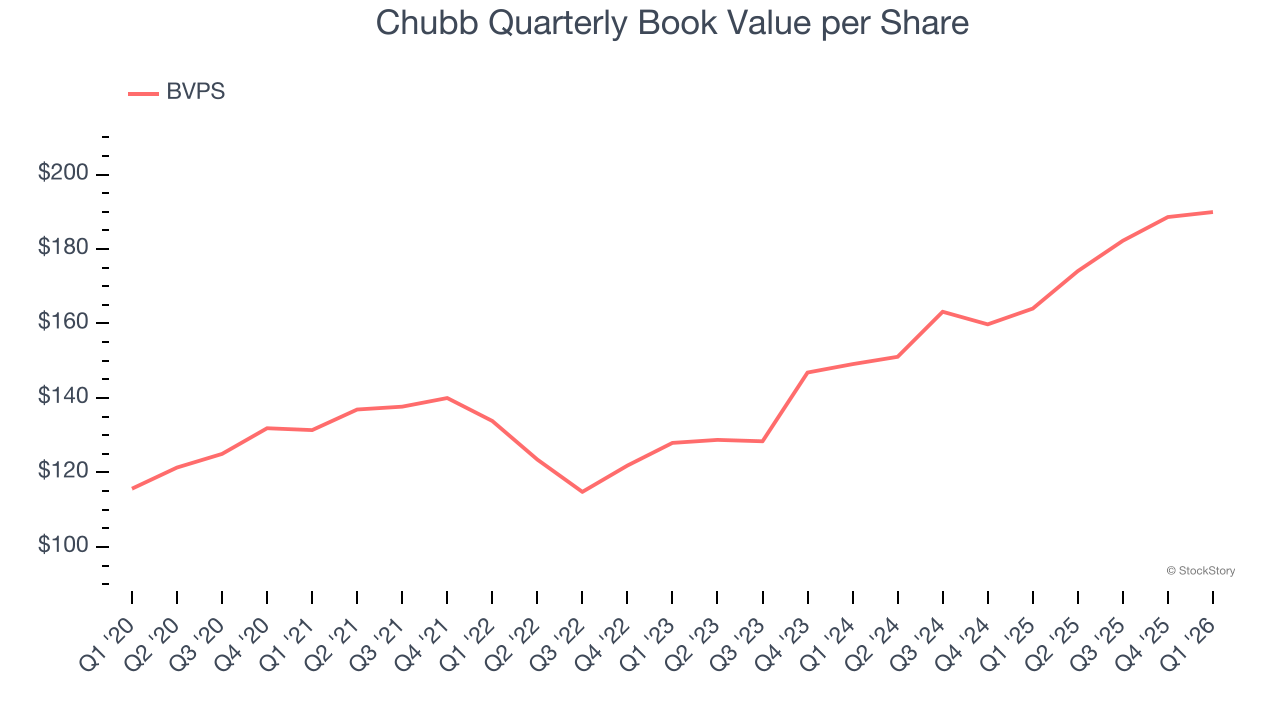
Over the next 12 months, Consensus estimates call for Chubb’s BVPS to grow by 21% to $206.98, elite growth rate.
Key Takeaways from Chubb’s Q1 Results
We were impressed by how significantly Chubb blew past analysts’ net premiums earned expectations this quarter. We were also excited its revenue and EPS outperformed Wall Street’s estimates. On the other hand, its book value per share missed. Zooming out, we think this was still a solid quarter. The stock remained flat at $328.45 immediately following the results.
Is Chubb an attractive investment opportunity at the current price? If you’re making that decision, you should consider the bigger picture of valuation, business qualities, as well as the latest earnings. We cover that in our actionable full research report which you can read here (it’s free).
