TTEC Trades Way Cheaper Than the Industry: Is It a Value-Trap?

TTEC Holdings, Inc. TTEC trades at a forward 12-month price-to-earnings (P/E) of 2.04X, significantly lower than the industry average of 21.26X. While this TTEC’s valuation could entice investors, the gap is alarming. A discount of this magnitude signals a value trap rather than a profitable bargain.
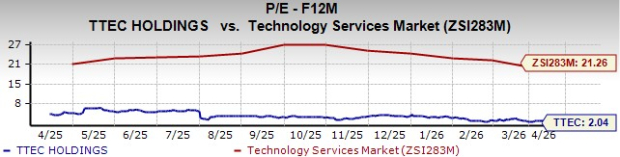 Image Source: Zacks Investment Research
TTEC’s balance sheet position is concerning. It held $905 million in long-term debt as of the end of the fourth quarter of 2025, while its market capitalization stood at $111.8 million. This depicts a risky scenario as the enterprise value is dominated by debt rather than equity, which is further solidified by its debt-to-equity ratio of 8, significantly higher than the industry’s 0.5. This high-leverage situation can make debt servicing expensive, stripping away earnings.
The company ended 2025 with a loss of $117.1 million due to an impairment charge incurred in the fourth quarter of 2025 related to the fair value of a TTEC Digital Reporting unit. This impairment might signal that the business unit is not worth as much as perceived. While the forward P/E uses earnings estimates, the market discounts those estimates if past performances are stained.
Liquidity concerns are lingering despite a current ratio of 1.89 reported in the fourth quarter of 2025, since the overall net cash per share is negative 16.93. On the off chance of any operational misses, the company may be compelled to dilute shareholders to pay debt, driving the bottom line. This could easily make the cheaper valuation obsolete.
TTEC Trades Cheaper Than Its Competitors
Maximus MMS and GenpactG are TTEC Holdings’ major competitors. Maximus and Genpact trade at 7.75X and 8.62X forward 12-month P/E, respectively.
P/E - F12M
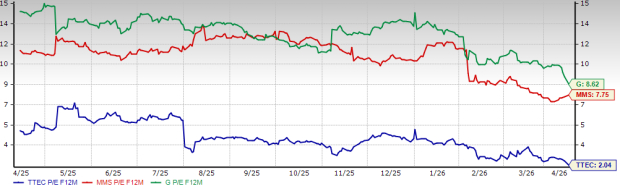 Image Source: Zacks Investment Research
TTEC Holdings’ Price Performance, Value Score & Estimates
The TTEC stock has dipped 33.5% in a year against 28.4% rally of its industry and 31.8% upsurge of the Zacks S&P 500 composite. Its competitors, Genpact, fell 24.6%, while Maximus moved up marginally.
1-Year Share Price Performance
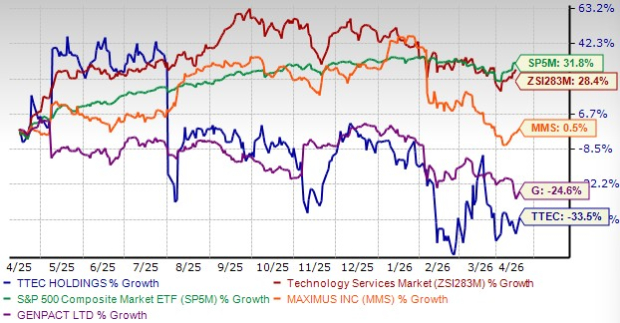 Image Source: Zacks Investment Research
TTEC Holdings, Genpact and Maximus carry a Value Score of A.
The Zacks Consensus Estimate for TTEC’s 2026 earnings has been flat at $1.2 per share over the past 30 days. For 2027, the earnings per share dipped 3.6% over the past 30 days.
TTEC Holdings currently sports a Zacks Rank #1 (Strong Buy). You can see the complete list of today’s Zacks #1 Rank stocks here.
Beyond Nvidia: AI's Second Wave Is Here
The AI revolution has already minted millionaires. But the stocks everyone knows about aren't likely to keep delivering the biggest profits. Little-known AI firms tackling the world's biggest problems may be more lucrative in the coming months and years.
SeeThis article originally published on Zacks Investment Research (zacks.com).
